This is the first article in a multi-article set that describes the basics of Kanban and explores applying Kanban to IT Processes. Part one provides a basic overview of Kanban and how it is used in manufacturing. The remaining parts explore sample scenarios to help generate ideas for your own environment.
Lately I have seen an increase in the number of articles in the Development and Agile Project Management communities that describe the merits of Kanban, showing the value that Kanban has helped provide in conjunction with Agile methods. Most of these articles focus heavily on the visualization aspect (Visualizing Agile Projects using Kanban Boards for example) though a few dig into other benefits of Kanban or simply claim Kanban is a silver hammer in search of a nail. In the IT community it seems that most of the material has been directed at software project management and IT Developers, but Kanban is applicable to many other areas of IT.
What is Kanban?
Kanban is a Japanese term for ‘visual board’ or ‘signboard’ and is a tool for reducing the cycle time1 of a process, increasing visibility into the flow of processes, and reducing the amount of In Process2 work. By leveraging the visibility into the process and flow between processes we can see where the work flow loses momentum and either bottlenecks or reduces the effectiveness of earlier steps. Kanban is used in Lean Manufacturing to gain visibility into the process and execution status, reduce wastes (and costs), and help achieve Just In Time production capability.
1. Cycle Time: The time it takes for an order to be produced from initial reception through completion
2. [Work] In Process: Incomplete products that are currently being worked on in the process or are waiting to re-enter the process and be completed. Unfinished work.
The Kanban Signal
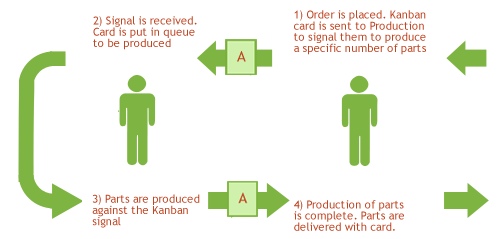
At it’s most basic, Kanban is a signaling system that tells earlier steps in a production process that there is a requirement or customer demand to make X.

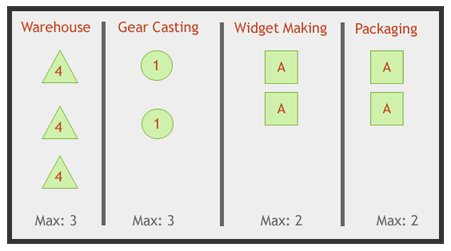
In a manufacturing process a customer order is converted into one or more cards that represent the production requirement to fulfill the order. Each card or symbol defines the product to be produced and quantity needed. The card is given to the associate responsible for managing the work center that will fulfill the production request. If the associate has a local sign or visual board to display the orders queue or available capacity, they will place the received card in the next empty slot, otherwise they update the board for the area. Depending on the complexity of the process, the receipt or execution of the Kanban signal may trigger additional signals back to prior steps in the process or to personnel responsible for bringing the correct materials to the production step. Each step has a limited number of slots on their board that defines the maximum number of cards that can be present at a given point in time. This Kanban limit keeps the amount of work and in process items constrained and prevents incomplete work or requests from piling up.

Limiting the amount of in process work to a small, maintainable number allows us to continue to fully utilize our resources (in this case machinery and operators) while reducing the amount of work that is partially completed and waiting to be finished. The application of Kanban limits to a process helps us start reducing the variability in the duration of producing a product, as well as remove the necessity (and temptation) to reschedule the flow or priority of work at each individual step. Though this may seem like it would slow response times when a priority order comes in, this actually speeds up processing because we don’t have to rearrange our resources to drop 47 outstanding, partially started tasks. We simply slot the priority order into the queue at the last step (when a spot is available) and let the signal flow back through the previous steps in a standard fashion. Since we have a limited amount of work in progress already, we are able to handle new requests quickly without interrupting items we have already promised.
By removing backlogged queues and re-prioritization between each step we have reduced the amount of non-value added work the operators are doing and improved both the accuracy and (usually) the duration of the time estimates we are giving the customer. We also reduce the number of changeovers that occur because we complete each task before moving to the next one, instead of switching back and forth between several outstanding orders. The removal of unnecessary changeovers are an immediate cost savings because they are of no direct value to the customer while the decrease in lead times improves our responsiveness to the end customer and reduced changeovers and rework increases our capacity without additional expense.
Visualization and Metrics
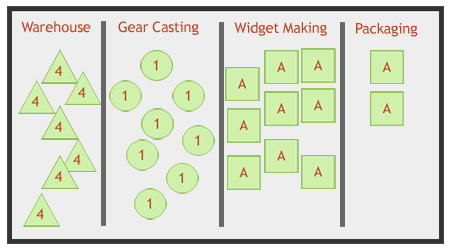
Visualizing the requests at each ‘station’ using a physical board is a good way to communicate across the group and manage your Kanban. If your board only has 3 physical areas or slots for ‘cards’ then your not going to take more than 3 requests. People at later and earlier steps can see progress being made as well as excess capacity (ie, nothing to do) at your step. The board is not only a method to manage your tasks but also an instant communications tool, allowing the area to focus more on doing the work and less on creating reports or filling in metric scorecards.

Finishing 2 Units/Day – ~14 days to produce new order
Another major benefit from Kanban methods will become apparent as the initial visual board is created. Besides driving the creation of a clear definition of the operations or production steps, the initial population of the board with current requests and WIP will start to make process bottlenecks evident. As time progresses and the kanban system forces you to reduce this backlog, the bottlenecks will continue to become more obvious, showing areas where direct improvement will affect the delivery time for the whole process. In many systems, when a previous step goes dry in a Kanban system the personnel from that step will start to move forward to help product clear the backlogged step. Simple rules or rearrangement of current staff can continue to give performance gains, as the board displays where slowdowns and hiccups occur as well as potential areas that are frequently left without work.

Finishing 2 Units/Day – ~5 days to produce new order
The manufacturing community has hundreds of examples of visual boards, but for the purpose of the article I’m going to point out a couple links from Agile software development articles. Kanban boards do not have to be expensive and, in my opinion, should always start out as a physical board before diving into a software solution (if ever).
- “Lean -Software Development in Small Teams” Article – Whiteboard and Magnets
- “Evolution of a Kanban Board” Article – Whiteboard and Post-Its &tm;
- “Visualizing Agile Projects with Kanban Boards” Article – Several pictures and informative article
- “The Kanban Story – Kanban Board” Article – Final (Simple!) Result for another software development board
Searching the internet will give you many additional examples in a variety of environments.
Applying Kanban to the IT Department
Now that we have an idea how Kanban works, we can begin exploring how to apply it to processes in IT administrative, support, and development environments. Initially the idea of applying Kanban in a non-manufacturing environment may seem challenging, so the examples will cover a wide range of possible situations. By exploring several sample implementations we can gain insight or ideas on how to apply these concepts (and see the resulting benefits) in our own individual IT environments.
Later articles will be published at one week intervals and announced on Twitter, Linked In, and of course the LTD front page
If you have missed prior articles in the series you can find them here:
Applying Kanban … Part 1: Kanban Overview
Applying Kanban … Part 2: Kanban applied to Tech Support
Applying Kanban … Part 3: Kanban applied to PC Deployment
Applying Kanban … Part 4: Kanban applied to a Development Group
Applying Kanban … Part 5: Challenges, Additional Concepts, and Wrapup


 My roles have included accidental DBA, lone developer, systems architect, team lead, VP of Engineering, and general troublemaker. On the technical front I work in web development, distributed systems, test automation, and devop-sy areas like delivery pipelines and integration of all the auditable things.

