I like it when I kick off a build and there aren’t any warnings. Unfortunately I’m forgetful and it’s always easier to edit the code now then it is 3 months later (when I remember to look at the warnings). When I put together my sample Continuous Delivery project, I was using Jenkins, which provided plugins for capturing warnings. It was nice to have visual feedback when I added a new warning, see how many were outstanding, have a list of outstanding warnings available on demand, and when I had a few minutes and fixed some of them, positive feedback by watching the warning chart slowly go down.
When I switch modes and work in TeamCity, I miss having that information available, with no extra steps from me. Despite several searches, though, I was never able to find a plugin that duplicated that behavior I liked in the Jenkins plugin. Turns out that TeamCity makes it pretty easy to roll your own, with just a little bit of powershell and some built-in features.
In this post I am going to cover capturing the warnings from an MSBuild build step, adding that warning count to the main dashboard, adding a statistics chart for the warning count over time, adding a condensed list to the end of the build log, adding the formatted list as a build artifact, and adding a custom report tab to report the warnings for each build.
Because who doesn’t need five different ways to see their warnings?
Capturing the Build Warnings
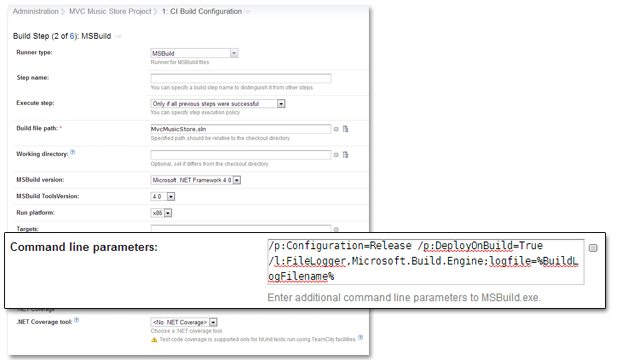
Since I am using MSBuild, the build warnings have a consistent pattern and MSBuild itself has an option to log out to a logger. We can add this attribute in either the build step or the Build Parameters. My preference is using the parameters of the build step in case I have multiple MSBuild calls in the build.
Parameter to add to MSBuild: /l:FileLogger,Microsoft.Build.Engine;logfile=%BuildLogFilename%

Adding the MS Build Parameter
Each time MSBuild runs, it will log it’s output to the specified file. We can use powershell to extract the warnings from the output, like so:
Param(
    [parameter(Mandatory=$true)]
    [alias("f")]
    $FilePath
)

$warnings = @(Get-Content -ErrorAction Stop $FilePath |       # Get the file content
                Where {$_ -match '^.*warning CS.*$'} |        # Extract lines that match warnings
                %{ $_.trim() -replace "^s*d+>",""  } |      # Strip out any project number and caret prefixes
                sort-object | Get-Unique -asString)           # remove duplicates by sorting and filtering for unique strings
Once we have the warnings extracted, we can move on to decide how we want them delivered.
Each section below will continue to add on to this script until it contains all the pieces we need to meet the display goals at the beginning.
Condensed Warning List in Build Log
The powershell script that is extracting warnings will need to run as a build step in the appropriate build configuration. This means that displaying a formatted list of warnings at the end of the build log is as simple as outputting that list from the powershell script we are building.
$count = $warnings.Count
Write-Host "MSBuild Warnings - $count warnings ==================================================="
$warnings | % { Write-Host " * $_" }
This will output a section at the bottom of the build log that contains our warnings, like so:

Warnings in the Bottom of a Build Log
Which I suppose is fine, but doesn’t really add that much value over the ones listed further up the log by MSBuild itself.
Condensed Warning List in Archived Text File
Now that I have formatted warnings, it’s pretty easy to create a file with those warnings and archive it. First I’ll update the script to take an output parameter and add some file output:
Param(
    [parameter(Mandatory=$true)]
    [alias("f")]
    $FilePath,
    [parameter()]
    [alias("o")]
    $RawOutputPath,
)

# ...

# file output
if($RawOutputPath){
    $stream = [System.IO.StreamWriter] $RawOutputPath
    $stream.WriteLine("Build Warnings")
    $stream.WriteLine("====================================")
    $stream.WriteLine("")
    $warnings | % { $stream.WriteLine(" * $_") }
    $stream.Close()
}
Then I’ll configure the project to capture that output file as an artifact:

Artifact Configuration
Et voila, the file shows up in my archived items:

List of archived items from a run
And I have a clean, archived list of my warnings:

Display of archived text file
But, really, we can do better.
Warning count in build status
Part of the goal was to be able to see the warning count change with no extra work, the best place I can think of to meet this is the final build status on each build.
Before:

Build status on dashboard
TeamCity provides support for setting the build status from a build script. By adding some output to the powershell script, like so:
#TeamCity output
Write-Host "##teamcity[buildStatus text='{build.status.text}, Build warnings: $count']"
Each successful build will also display the number of warnings that were captured.

Build status on dashboard, with warnings
Better, but what about historical values? And I still don’t like that text file artifact.
Warning Count as a Custom Chart
TeamCity also provides the ability to add custom charts based on either built-in or custom statistics. Custom statistics are reported similar to the build status output above:
Write-Host "##teamcity[buildStatisticValue key='buildWarnings' value='$count']"
Adding a custom chart requires us to dig into the configurations of TeamCity. I’m going to add a chart that will be displayed for any build that provides the warning count number above, so I’ll open the [teamCity data dir]/config/main-config.xml file and add the following section:
<graph title="Build Warnings" hideFilters="showFailed" seriesTitle="Warning" format="">
    <valueType key="buildWarnings" title="Warnings"/>
</graph>
This will add a chart to the Statistics tab of the build. After a few builds this is what I have:

Build Warning Statistics
It probably would look better if I hadn’t built with the same number of warnings each time, but you get the point. The mouse hover works just like the built-in charts, linking to the run status for the individual point.
Ok, getting better, but I think we can take it one step further.
Adding a Custom Build Warnings Tab
So far we have improved methods of seeing the warning count and watching how it changes over time, but the actual list still leaves something to be desired. Luckily, TeamCity supports custom report tabs in the Build Results. This gives us an easily accessible place to put the warnings and, since it uses HTML, better formatting options than the text file.
First I need to update the powershell script to output the HTML file. TeamCity will be picking up an entire folder for the report tab, so I could add some external CSS or image files for my report, but I’ll leave that for another day.
# html report output
$check = Test-Path -PathType Container BuildWarningReport
if($check -eq $false){
    New-Item 'BuildWarningReport' -type Directory
}
$stream = [System.IO.StreamWriter] "BuildWarningReport/index.html"
$stream.WriteLine("<html><head></head><body><h1>$count Build Warnings</h1>")
$stream.WriteLine("<ul>")
$warnings | % { $stream.WriteLine("<li>$_</li>") }
$stream.WriteLine("</ul>")
$stream.WriteLine("</body></html>")
$stream.Close()
I’ve added HTML output to the script with a hardcoded output location that ensures the report directory exists before writing the index.html page. I’ve hardcoded this value to reduce the amount of thinking ’ll need to do as I add this to other projects (keeps it consistent from output name to artifact setting to report tab configuration).
The next step is to configure the project to capture the folder as an artifact:

Artifact configuration
Then the last step is to modify the TeamCity configuration to recognize that when I output archives like that, I want to treat them as a report. To do this I add the following chunk of XML to my [TeamCity data directory]/config/main-config.xml file (per the documentation link above):
<report-tab title="Build Warnings" basePath="BuildWarningReport" startPage="index.html" />
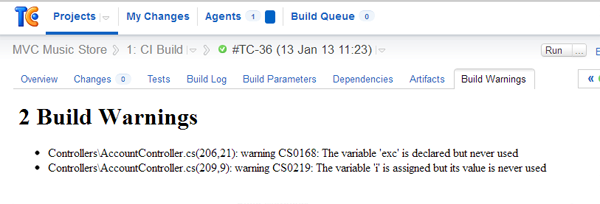
And there we go, the custom report tab is available in the build results:

Build Warnings tab in Run Results
Which takes us from no visibility into our warnings, to five different methods of viewing the information.
Wrap-up
From having to Ctrl+F through the build log all the way to plugin-level output in a few easy steps. After setting this up one time, the only pieces that needed to be repeated for additional builds are the addition of the /logger parameter for MSBuild and the powershell build step to extract the results, and capturing the artifact for the HTML page. All of the output is either built in to the script or applies to the whole server and is displayed whenever the statistics or archive are present in a build.
Here is the finished script:
Param(
    [parameter(Mandatory=$true)]
    [alias("f")]
    $FilePath,
    [parameter()]
    [alias("o")]
    $RawOutputPath
)

$warnings = @(Get-Content -ErrorAction Stop $FilePath |       # Get the file content
                Where {$_ -match '^.*warning CS.*$'} |        # Extract lines that match warnings
                %{ $_.trim() -replace "^s*d+>",""  } |      # Strip out any project number and caret prefixes
                sort-object | Get-Unique -asString)           # remove duplicates by sorting and filtering for unique strings

$count = $warnings.Count

# raw output
Write-Host "MSBuild Warnings - $count warnings ==================================================="
$warnings | % { Write-Host " * $_" }

#TeamCity output
Write-Host "##teamcity[buildStatus text='{build.status.text}, Build warnings: $count']"
Write-Host "##teamcity[buildStatisticValue key='buildWarnings' value='$count']"

# file output
if($RawOutputPath){
    $stream = [System.IO.StreamWriter] $RawOutputPath
    $stream.WriteLine("Build Warnings")
    $stream.WriteLine("====================================")
    $stream.WriteLine("")
    $warnings | % { $stream.WriteLine(" * $_") }
    $stream.Close()
}

# html report output
$check = Test-Path -PathType Container BuildWarningReport
if($check -eq $false){
    New-Item 'BuildWarningReport' -type Directory
}
$stream = [System.IO.StreamWriter] "BuildWarningReport/index.html"
$stream.WriteLine("<html><head></head><body><h1>$count Build Warnings</h1>")
$stream.WriteLine("<ul>")
$warnings | % { $stream.WriteLine("<li>$_</li>") }
$stream.WriteLine("</ul>")
$stream.WriteLine("</body></html>")
$stream.Close()
To recap, we started with some warning messages randomly scattered across the build log. We ended with the warning count automatically showing in the build status on the dashboard, a nice chart of the number over time, and three different ways to view the detailed list. I hope this proves useful to others as well, now I have to go and fix the sample warnings I added before I forget about them. 🙂


 My roles have included accidental DBA, lone developer, systems architect, team lead, VP of Engineering, and general troublemaker. On the technical front I work in web development, distributed systems, test automation, and devop-sy areas like delivery pipelines and integration of all the auditable things.

