Over the series of 12 posts, I have built a continuous delivery pipeline around the MVC Music Store tutorial web site. The journey included making changes to support unit testing, creating a CI build, adding automated multi-environment deployment, automated interface testing, automated load testing stage, and static analysis. Up until now, this was entirely on Jenkins, but today I intend to re-implement the pipeline on TeamCity.
General Feelings
My general feelings towards TeamCity during this process have been good. I found several places where TeamCity would have been easier to use [than Jenkins], such as parsing test result files and evaluating results. I like the visibility of pending changes for each build step and everything I have implemented has been extremely straightforward (though I haven’t taken on custom graphs and code coverage yet). Wiring together dependencies was far easier and clearer then in Jenkins, and the build-level configurations and sharing of build numbers throughout the build was a lot cleaner. Little touches like previews for the artifacts and working directories were also extremely handy.
Not everything was perfect, however. The build chains were as close as I could get to a pipeline visualization and they are busier then the pipeline view in Jenkins. There also wasn’t an obvious way to use a build chain view for the dashboard. Rerunning steps in the build would create a whole new chain, rather then being treated as a retry of a prior run of the same snapshot. The plugins don’t feel quite as first class in TeamCity as they did in Jenkins, but the built in functionality was quite a bit more extensive, so I think this just comes down to focus and my own experience (or lack) with the tools.
But enough of my feelings, lets do some technical stuff.
Review of the Build Process
The build pipeline is the process the code goes through from committing the code to eventual delivery, automated where possible to minimize the lead time for new features and wire in good practices I want to follow. The code is built and passes through a variety of tests and checks at each step, with only a few configurations changing along the way, ensuring what is released has passed every step as quickly and consistently as possible (smooth is fast).
The current Jenkins build pipeline looks like this (plus lots of static analysis that doesn’t fit in the picture):

Continuous Delivery Pipeline with Load Test Step
These are the portion I intend to do in TeamCity:
- CI Stage
- Monitors main code repository, execute build, run unit tests, deploy to ensure deployable, smoke test deployment
- Interface Testing
- Monitors interface test code repository, deploys + smoke tests deployment, runs interface tests
- Load Testing
- Monitors load test code repository, deploys + smoke tests deployment, runs load test
- QA Deploy
- Manual QA deployment for imaginary QA department
- Prod Deploy
- Manual production deployment
I will be leaving the load test results graph and static analysis until a later post.
Server Setup
Since my original post I have setup a dedicated Hyper-V server on Windows 2012 RC and moved the original AVL-BUILD-01 and AVL-BETA-01 server to this host, adding an AVL-SQL-01 that serves as a host for environment-specific MSSQL databases. I created the new TeamCity build server (AVL-BUILD-02) to match the original, including same versions of OS, Visual Studio, etc:
Initial Installs:
- Windows 2008 R2 + lots of Windows updates
- Visual Studio 2010 + more updates (SP1, etc)
- ASP.Net MVC3
- TeamCity 7.1
- Mercurial 2.3.0 (only version difference from AVL-BUILD-01)
- Web Deploy 2.1
- WCAT 6.3
- FireFox 146 (or whatever)
As noted, the Firefox and mercurial installs didn’t match, version-wise, but everything else I kept the same as the Jenkins build server.
Creating the CI Build
The CI project is probably the most complex one due to the number of steps and fact that it serves the artifacts every later step will use.
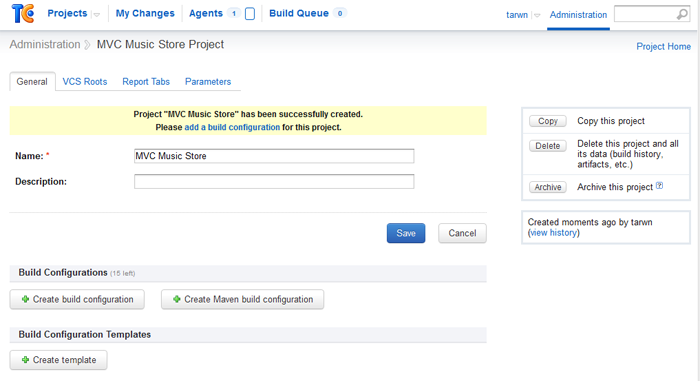
1: Create the project
The project serves as the container for the builds, creating one only requires a name and optional description:
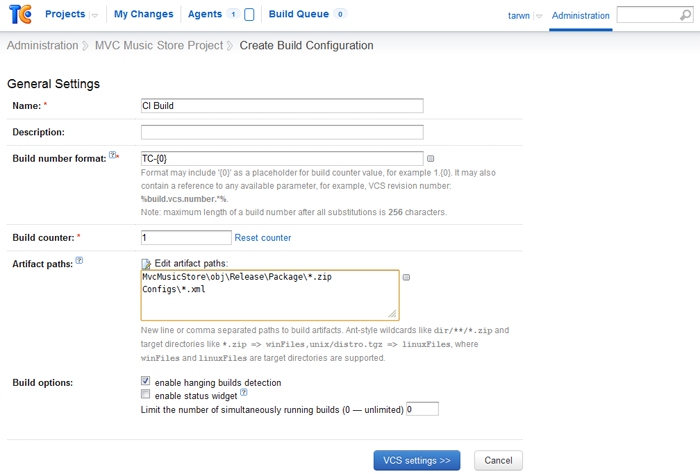
Once the project is named, I can add my first build step (don’t worry, I’ll only do these screen shots one time):
Here I’ll name the build step and define the artifacts I want to store for later use, including the deployment package I intend to make and the folder of environment-specific configurations.
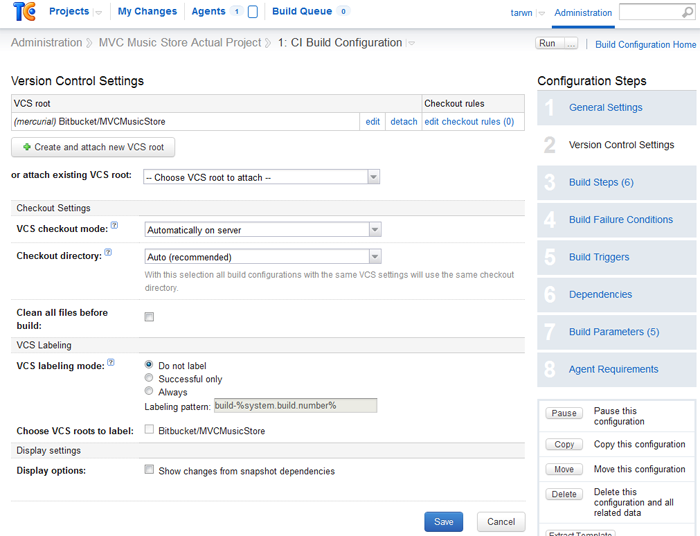
Next is the settings for the main site code repository. To create VCS settings for the build we need to create the VCS root (which includes the polling settings) then define the settings that are specific to this build.
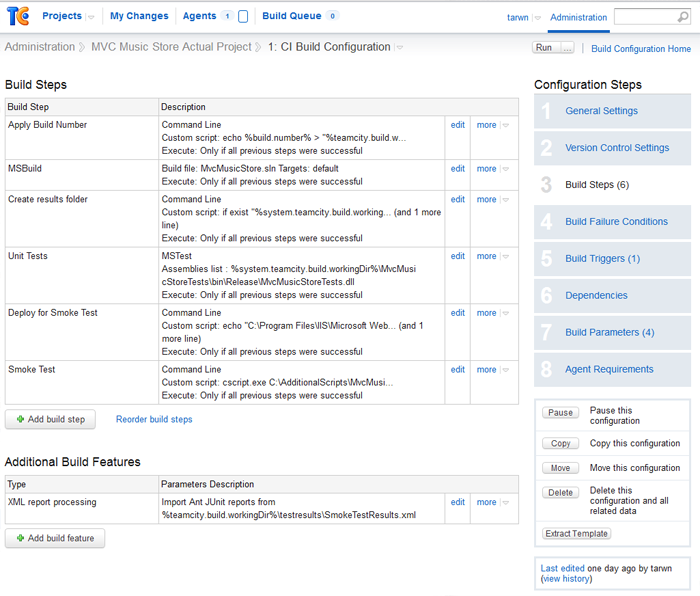
At this point I can start adding my build steps. These build steps will duplicate the ones I used in Jenkins. An advantage over the Jenkins setup is that the MSBuild runner already has versions configured and there is a built-in MSTest runner. When entering the command-line calls I used in Jenkins, I’ll substitute in TeamCity variables using the small  image next to the inputs.
Below the build steps I have used the report processing feature to process the results of the smoke test script (original post here), which outputs in JUnit format. TeamCity will automatically collect the results from the MSTest step and this step and make them available in the summary and run details.
The second to last steps is to setup a build trigger to run on VCS changes, which is a couple clicks and extremely straightforward.
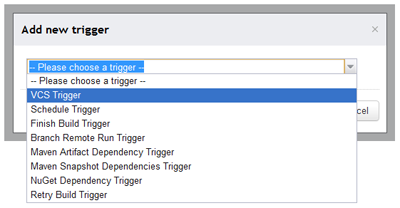
Team City – Adding a Trigger
Then the last step is to define the build parameters. TeamCity automatically detected the extra unrecognized parameters from my command-line build steps and has added them to the list of build configurations, which I thought was pretty slick. To make it even better, I can reference these parameters from later builds to reduce the number of places I need to define unique settings.

Team City – Build Parameters
Once I have finished setting up this build, I can return to the main dashboard and run it on demand by pressing the “Run” button.
And we have the first build stage done.
Creating the Interface Testing Build
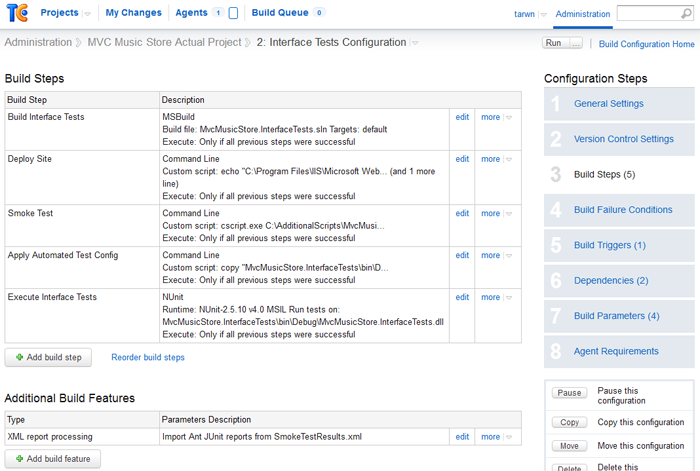
The interface testing build (original post here) is only a few steps. The first few stages of this build are the same, I create the build, define a VCS root that points to the Interface testing project on BitBucket, then add the build steps. I use an MSBuild step to build the automated interface test project (SpecFlow, Nunit, Selenium), command-line steps to call MSDeploy and the smoke test script, copy in the automated test settings for the tests, then use the built-in Nunit test runner to run the automated test assembly.
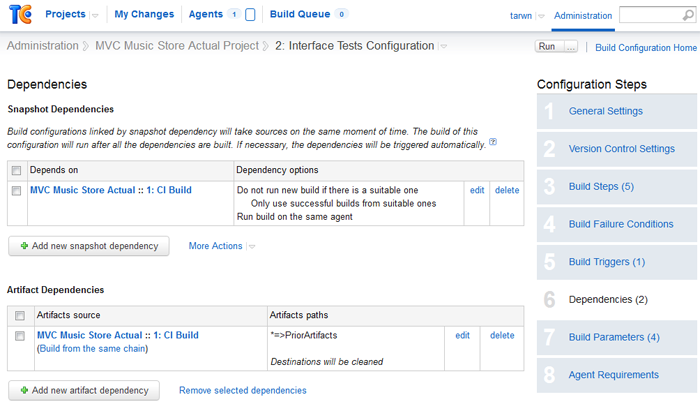
Skipping ahead to the Dependencies section, I’ll add a snapshot dependency on the CI stage so that builds of the Interface stage use snapshots from the same point in time as it’s linked CI build. I’ll also add an artifact dependency to pull all of the artifacts from the CI build into a local folder named PriorArtifacts, keeping with the pattern I used in the Jenkins build.
Next I add a build trigger to run after a successful build of the CI stage and fill the dependencies with references to the values from the CI Build where I can.

Team City – Build Parameters
And the last step is to return to the project screen and define the Artifacts for this stage as “PriorArtifacts/*” so it will pass on all of the artifacts it pulled in from the prior stage.
Running this build reminded me that Firefox has a nasty habit of downloading updates when you least want them, as the interface tests started timing out because they couldn’t quit. A quick tweak to the Firefox settings and I have a successful interface test step running, with the test results showing in the summary just like the CI stage.

Team City – Interface Tests
Note: The build number for each build allows you to define your own pattern. By setting it to %dep.bt2.build.number%, each of my builds use the build number I created in the CI stage (which is used again in the smoke tests).
Creating the Load Test, QA, and Prod Builds
At this point I have all the pieces I need to finish out the last 3 stages.
Load Test Build
The Load Test stage (see original here) gets the same build number and artifacts as the Interface Testing stage. I add a new VCS root to pull down the load tests scripts from BitBucket, deploy, smoke test, then run the run.cmd file that runs the WCAT load test. I skipped the challenging part of this, which is turning the results into a chart, but as I mentioned earlier that sounds like it will be a follow-up post of it’s own. The dependencies, parameters, and build trigger are set up the same as the Interface testing build.
Deploy QA and Deploy Prod Builds
The last two are rinse and repeats. Take the build number and artifact settings, no VCS settings, add dependencies and leave them to be triggered manually.
The Pipeline
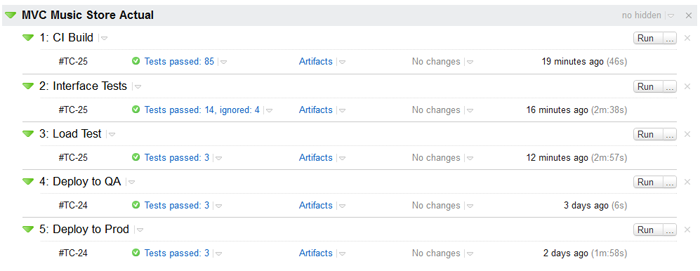
Those 5 builds compromise the core of the pipeline and show up in the TeamCity dashboard like so:
To get to the build chains view, go into the Project page and click the last tab to the right, titled “Build Chains”.
The summary bar lists the final step and status in the chain, the last step that ran, and the date. Expanding it shows the full chain (though there are some scrolling issues).
Last Words
This was an interesting project, as I was able to take a fairly complex build and see how it would work in a completely different engine. The addition of a first class pipeline view is probably the biggest item on my wishlist and I look forward to seeing what they do with it in the future. Even without that, though, it was a great tool to use and offered me none of the teething problems I had with several of the Jenkins plugins.




 My roles have included accidental DBA, lone developer, systems architect, team lead, VP of Engineering, and general troublemaker. On the technical front I work in web development, distributed systems, test automation, and devop-sy areas like delivery pipelines and integration of all the auditable things.

