Introduction
When I talk about smoothing I think of two things in the programming world. The first is for images when you want to “blend” hard edges and the second is the smoothing of a graph with the purpose of cutting down on noise, this is the one I will be talking about today.
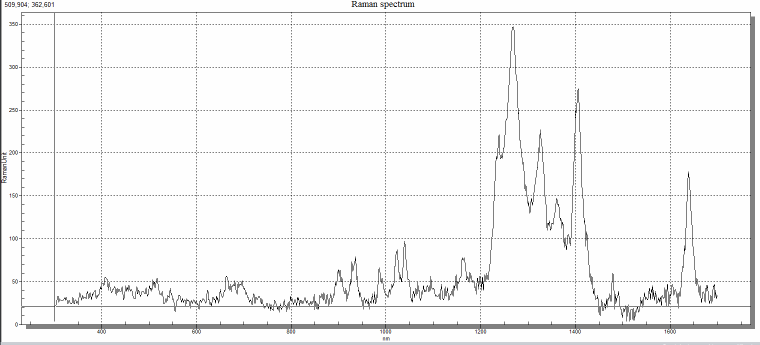
Let’s say we start off with a graph like this.

Why would you use smoothing on a graph? Well, to make it look pretty in the first place and to impress co-workers. And then to do better peak searching or give better predictions. Or just to do what the client wants.
Anyway, understanding how this works is interesting and finding the answers on Google wasn’t easy, for some reason those mathematicians think I understand them. But I understood some of them and finally came to a good result. Most of it is based on this article by Robert Mellet (I thank him for that) unfortunately, it is in French).

First of all, let me try and explain how this works in simple terms, you can find the less simple explanations in the references.
First thing to note is that the smoothing works with windows and that you can have windows of 5,7,9,11,13,15,17,19,21,23 and 25. We can see that windows are odd numbered and for a good reason too. The smoothing is done by recalculating the original value based on what is in front and after it. So a window of 5 will use the 2 numbers in front, the number itself and 2 numbers after that.
For the following values 21,21,23,24,26,22,24 and 22 and with a window of 5 we would calculate the first value as follows. The first value being 23 in this case, because our window is 5 we need at least 2 numbers before ours to calculating value (window / 2).
So the first and last coordinates are never really smoothed and we can keep them as is or chop them off.

Did you see the not smoothed part?
Knowing all that, we can do the calculations on the actual coordinates we want and show them to the user.
The code
Still with me?
I guess someone still is.
So here is the code. I won’t bore you with all the unit tests I wrote for this but let’s just say that some of them are not short because you need lots of data to confirm it does everything right on all occasions.
Option Infer On
Imports TDB2007.Dal.Model.Raman.Parameters

Namespace Raman

    ''' <summary>
    '''
    ''' </summary>
    ''' <remarks></remarks>
    Public Class RamanSmoothSavitskyMelletMethod
        Implements Interfaces.IRamanCoordinatesDecorator

#Region "Constructors"

        Public Sub New()

        End Sub

#End Region 'Constructors

#Region "Methods"

        Public Function Decorate(ByVal RamanCoordinates As System.Collections.Generic.IList(Of Interfaces.IRamanCoordinate), Optional ByVal Parameters As Object = Nothing) As System.Collections.Generic.IList(Of Interfaces.IRamanCoordinate) Implements Interfaces.IRamanCoordinatesDecorator.Decorate
            Dim ReturnList As System.Collections.Generic.IList(Of Interfaces.IRamanCoordinate) = New System.Collections.Generic.List(Of Interfaces.IRamanCoordinate)
            If Parameters Is Nothing Then Parameters = New SavitskyMelletSmoothParameter(SavitskyMelletSmoothParameter.DegreeOfSmoothingEnum.DegreeOfSmoothing9)
            Dim _SavitskySmoothParameter As SavitskyMelletSmoothParameter = CType(Parameters, SavitskyMelletSmoothParameter)
            If RamanCoordinates Is Nothing OrElse RamanCoordinates.Count < _SavitskySmoothParameter.DegreeOfSmoothing Then
                Return ReturnList
            End If
            Dim LowerLimit = Convert.ToInt32((_SavitskySmoothParameter.DegreeOfSmoothing + 1) / 2) - 1
            Dim UpperLimit = Convert.ToInt32(RamanCoordinates.Count - (_SavitskySmoothParameter.DegreeOfSmoothing - 1) / 2) - 1
            For Counter As Integer = 0 To LowerLimit - 1
                ReturnList.Add(New RamanCoordinate(RamanCoordinates(Counter).RamanUnit, RamanCoordinates(Counter).WaveLength))
            Next
            For Counter As Integer = LowerLimit To UpperLimit
                Dim Sum As Decimal = 0
                For InnerCounter As Integer = 0 To _SavitskySmoothParameter.DegreeOfSmoothing - 1
                    Sum += RamanCoordinates(Counter + InnerCounter - LowerLimit).RamanUnit * _SavitskySmoothParameter.SmoothingParametersPerDegree(InnerCounter)
                Next InnerCounter
                ReturnList.Add(New RamanCoordinate(Sum / _SavitskySmoothParameter.SmoothingNormPerDegree, RamanCoordinates(Counter).WaveLength))
            Next Counter
            For Counter As Integer = UpperLimit To RamanCoordinates.Count - 1
                ReturnList.Add(New RamanCoordinate(RamanCoordinates(Counter).RamanUnit, RamanCoordinates(Counter).WaveLength))
            Next
            Return ReturnList
        End Function

#End Region 'Methods

    End Class

End Namespace
The decorate function takes 2 parameters. First, a list of IRamanCoordinate, which is a very simple valueobject that has room for WaveLength (let’s call it x) and RamanUnit (the actual value or y). Then you have an optional parameter of type Object (because I can use it to decorate a ramanspectrum with many different kinds of things) that should be a SavitskySmoothParameter.
I will warn my casual user that this is bad but it was the first thing that came to mind and since those values are not about to change I won’t refactor it (perhaps I will but not today). I think I should have split it up in smaller classes for each window. Since this has become a rather big thing. On the other hand it only contains data (very static data, never to be changed again). So I put it in a txt file so as to not make this post too long.
Conclusion
So I think you have everything now. Sorry for boring you to death.


 Chris is awesome.