


Today I finaly had some time to sacrifice to finding why my application was slow at startup (around 30 seconds). So I opened up JetBrains’s dotTrace and went to work. In less then half an hour I shaved at least 10 seconds of the startup time.
So here is the first profiler screenshot.
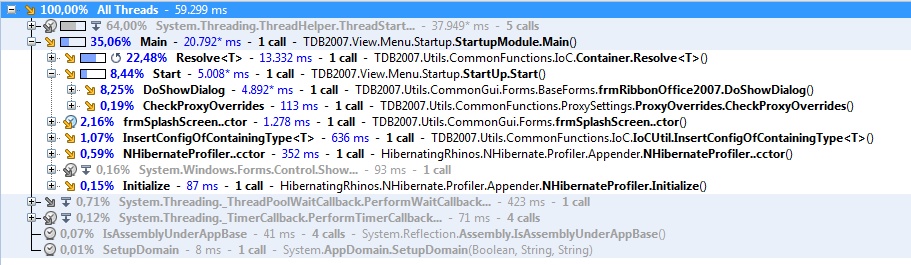
Here we can see that the main method takes 20 seconds to run and that resolve<T> takes the most time.
Now lets drill down and see if we can find one that takes up most of that time.

As we can see FindAllPimsCases lin LoadList takes up 9 seconds of my time and it’s not even needed (it’s a connection with a very slow Oracle database). So I delete it.
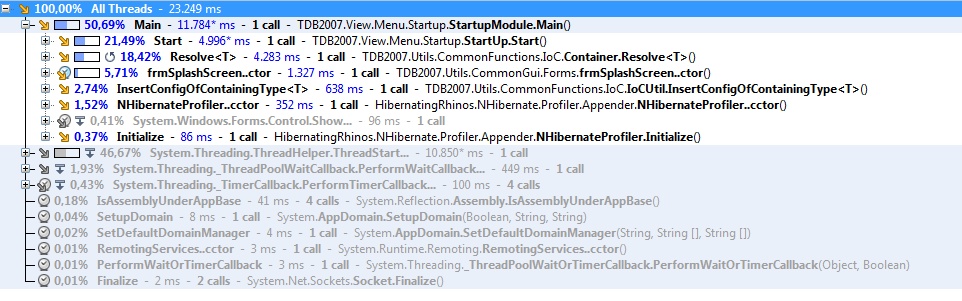
And the result is above. Main now takes 11 seconds to run. Which is acceptable for now.
 Chris is awesome.