


This blog is part of my series Making Data Tell a Story With SSRS Properties.
Property: Minimum, Maximum, and Interval
The purpose of these properties is to define the minimum and maximum values on a chart axis, and the intervals shown.
To access the properties, select a chart axis and select Minimum, Maximum, or Interval.
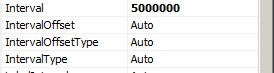
By default, all three are set to Auto. You can set them to any valid range.
Example: I have a line chart that shows sales by product category per year. The default Auto settings show from $0 to $20,000,000.
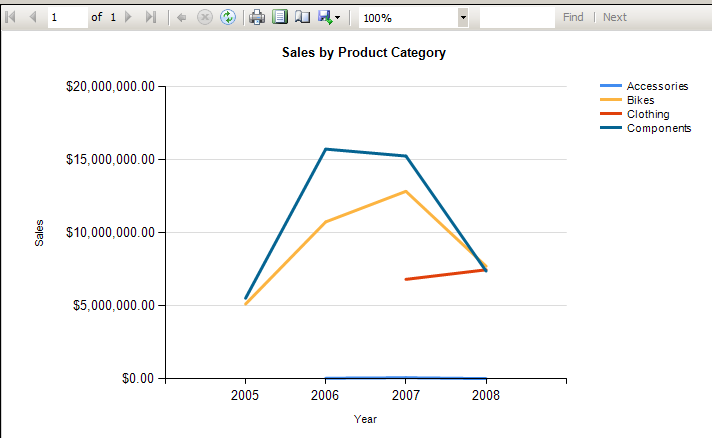
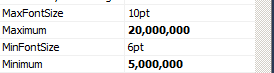
I want to show a range of values from $5,000,000 to $17,500,000, and display an interval of $2,500,000. I set Minimum to 5,000,000, Maximum to 17,500,000, and Interval to 2,500,000.


When I run the report, the intervals on the vertical axis have been adjusted.

Further Reading:
 Jes Borland is a Premier Field Engineer - SQL Server for Microsoft, where she is a trusted technical adviser, deep technical support, and teacher for her customers. Her experience as a DBA, consultant, and 5-time Data Platform MVP allow her to help the business and the IT teams reach their goals. She has worked with SQL Server as a developer, report writer, DBA, and consultant. Her favorite topics are administration, automation, and performance. She frequently presents at user groups, SQL Saturdays, and other community events. She is also an avid runner and chef.
