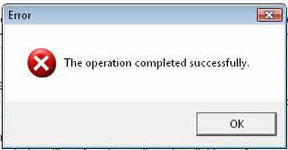
SSRS errors are not friendly

Today a friend of mine asked for a hand with an SSRS error he was getting. I have to admit, at the time I was pretty busy and feel bad that I didn’t answer the question completely. The error was resolved though and the find/fix by him was impressive to say the least. One thing that was frustrating for both of us was the error presented from the report server when this particular report execution failed. In short, the error was not helpful at all. There is resource to find more in-depth descriptions on the error though by turning to the trace logs that are enabled on reporting services. Below, we will go through searching for these descriptive errors in the logs.
On the report server, navigate through the directory structure to the installation folders for the SSRS binary files. In these folder you will find a folder named, LogFiles. This folder will house the default report server trace logs. All execution trace events will be logged in these flat files and can be excellent information to troubleshooting report execution issues. After understanding the trace files, it is also a great way to utilize SSIS to import and report off of them to be more proactive on the report executions.
To read in-depth on the trace logs see, “Report Server Service Trace Log”
Learning how the log files are recycled can be key on finding the file that will help you in a troubleshooting session. The following extract from the BOL documentation explains just how this process is handled.
“The trace log file is ReportServerService
.log. The trace log is an ASCII text file. You can use any text editor to view the file. This file is located at Microsoft SQL Server _”Reporting ServicesLogFiles. The trace log is created daily, starting with the first entry that occurs after midnight (local time), and whenever the service is restarted. The timestamp is based on Coordinated Universal Time (UTC). The file is in EN-US format. By default, trace logs are limited to 32 megabytes and deleted after 14 days
Knowing the recycle times and when a new log is created can lower the length of time spent on searching them for the error needed.
Troubleshoot the report error
To show an error in a real-life scenario, I forced a deadlock while executing a report. In Reporting Services the error messages presented in reporting frontend and in the tables located in the ReportServer are limited. This isn’t a horrible aspect given the amount of further logging we have to utilize.
Behind the scenes we need to determine the root cause of the error still to resolve the error. The first place to check for further information would be the ExecutionLog view. This will allow you to see the high level report server error and the error that can be presented to the user.
To do this we can select from the ExecutionLog view based on the ReportID at hand. In this case, the Status column results were rsProcessingAborted for the report that presented was forced into a deadlock. We now know that the report was the initial failure and can go further into determining the root cause.
The next step is to review the Report Server Service Trace Log to obtain a full stack of the error.
Open the LogFiles directory
Example path: C:SQLBINARYMSSQL.3Reporting ServicesLogFiles
Determine the time the error occurred and open the log file that coincides with the error. In order to find the error quickly, you can search for the logical name of the report. When searching for this particular report name, the following stack trace was found
_ReportingServicesService!library!a!03/29/2010-16:20:07:: i INFO: Call to RenderFirst( ‘/folder/report name’ ) ReportingServicesService!processing!a!3/29/2010-16:20:41:: e ERROR: Throwing Microsoft.ReportingServices.ReportProcessing.ReportProcessingException: Cannot read the next data row for the data set {me}., ;
Info: Microsoft.ReportingServices.ReportProcessing.ReportProcessingException: Cannot read the next data row for the data set {me}. —> System.Data.SqlClient.SqlException: Transaction (Process ID 306) was deadlocked on lock resources with another process and has been chosen as the deadlock victim. Rerun the transaction.
at System.Data.SqlClient.SqlConnection.OnError(SqlException exception, Boolean breakConnection)
at System.Data.SqlClient.SqlInternalConnection.OnError(SqlException exception, Boolean breakConnection)
at System.Data.SqlClient.TdsParser.ThrowExceptionAndWarning(TdsParserStateObject stateObj)
at System.Data.SqlClient.TdsParser.Run(RunBehavior runBehavior, SqlCommand cmdHandler, SqlDataReader dataStream, BulkCopySimpleResultSet bulkCopyHandler, TdsParserStateObject stateObj)
at System.Data.SqlClient.SqlDataReader.HasMoreRows()
at System.Data.SqlClient.SqlDataReader.ReadInternal(Boolean setTimeout)
at System.Data.SqlClient.SqlDataReader.Read()
at Microsoft.ReportingServices.DataExtensions.DataReaderWrapper.Read()
at Microsoft.ReportingServices.DataExtensions.MappingDataReader.GetNextRow()
— End of inner exception stack trace —_
We can now see that the root cause of the report failure was, “Transaction (Process ID 306) was deadlocked on lock resources with another process and has been chosen as the deadlock victim. Rerun the transaction.”.
In closing
The Report Server Service Trace Logs are a great resource for troubleshooting errors on your reporting instances. By default, the trace is enabled and I highly recommend keeping it that way so when errors do present themselves, answers can be quickly found and resolutions formulated.


