Deadlocks in a SQL Server instance are problematic. They can cause application errors, slow performance, and unhappy users. As a DBA or developer, it’s very helpful to be able to find deadlocks, review what caused them, and fix it permanently, if possible.
How do you find deadlocks? Over the years, there have been various methods, depending on what tools were available in SQL Server. Many of us used to run a Profiler or server trace to capture the Deadlock Graph event – useful if we knew when they were occurring (or they occurred all the time). We could also enable trace flags 1204 and/or 1222 to write the information to the event log – better if we knew there were issues, but they weren’t predictable.
However, I don’t like a messy event log. I like it neat and clean, so I can see errors easily. For example, I enable TF 3226 to suppress “Log was backed up” messages. With SQL Server 2012+, I also prefer to use the Extended Events default system_health session to view deadlock graphs – with no extra work required!
Let me walk through what a deadlock looks like with TF 1222 and compare that to the XE session.
In my instance, I have TF 1222 enabled.
I have simple code to create a deadlock. You can use this as an example in a test environment to replicate it.
/* Create deadlock - query 1 */

USE tempdb;
GO

CREATE TABLE tbl1 (id INT NOT NULL PRIMARY KEY CLUSTERED,
       col INT)
CREATE TABLE tbl2 (id INT NOT NULL PRIMARY KEY CLUSTERED,
       col INT REFERENCES tbl1(id))

BEGIN TRANSACTION
INSERT INTO tbl1 VALUES (2, 999);

/* Now, open a second query and paste this */
USE tempdb;
GO
BEGIN TRAN
INSERT INTO tbl2 VALUES (111, 2);

/* Come back here and execute this */
INSERT INTO tbl2 VALUES (111, 555);
COMMIT TRAN
When I run the last statement, I receive an error that one of the processes was the deadlock victim.
If I open the error log, I can see the details of the deadlock. Every bit of information is on a separate line.
This one isn’t bad, but imagine a multi-statement deadlock, or a server with several deadlocks in an hour – how do you easily see if there were other errors on the server at the same time?
With SQL Server 2012+, we have a better tool to see when deadlocks occur – and the deadlock graphs are saved by default, so we don’t have to read the text version to figure it out, or run a separate trace to capture them.
In SSMS, open Object Explorer and navigate to Extended Events > Sessions > system_health > package0.event_file. Double-click to view the data.
I go right to Filters to find the xml_deadlock_report events.
Here you’ll see deadlocks that have occurred. The Value field will show the XML values that you also see in the log. You can double-click on the Value field to bring up the XML.
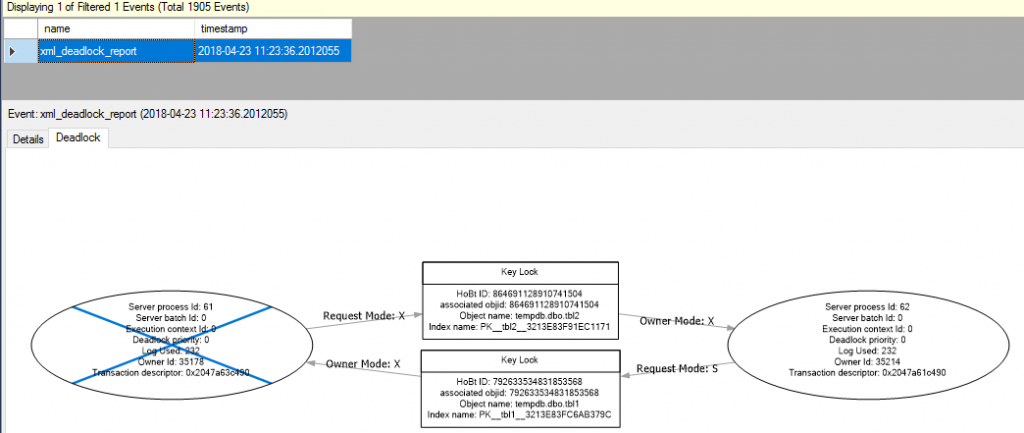
Don’t ignore that sneaky “Deadlock” tab, however – that’s where you’ll find the easier-to-read deadlock graph!
A good description of deadlock graphs, and how to interpret them, can be found at https://www.sqlshack.com/understanding-graphical-representation-sql-server-deadlock-graph/.
As you modernize your data platform, you should update your troubleshooting methods and tools as well. This is an easy example of taking advantage of Extended Events to solve an old problem!


 Jes Borland is a Premier Field Engineer - SQL Server for Microsoft, where she is a trusted technical adviser, deep technical support, and teacher for her customers. Her experience as a DBA, consultant, and 5-time Data Platform MVP allow her to help the business and the IT teams reach their goals. She has worked with SQL Server as a developer, report writer, DBA, and consultant. Her favorite topics are administration, automation, and performance. She frequently presents at user groups, SQL Saturdays, and other community events. She is also an avid runner and chef.
