


With high availability, the least amount of time data is unavailable, the higher the up-time percentage that is achieved. Uptime is a period of time in which equipment is available for use by users. Even a 5 minute failover time can have a negative impact on an uptime goal of 99.999% availability. Each point of failure that can cause downtime should be considered in the overall equation for uptime. Since each component has a specific requirement and must be functioning properly to deliver the source to the requestor, this is a way to calculate achievements based on an entire team including server, network, and data. Calculating the mean uptime or, mean availability, is how this is done.
Mean Uptime Equation
The mean uptime equation takes into account any object that can prevent a request from reaching the originating requester. The object can be a computer, appliance, database server, server, network or storage. Consider each one of these pieces in planning database availability is critical. For example, if a database server’s high availability has maintained the five nines but the appliance that maintains availability of the VPN capabilities to reach that database server had a loss of 10% on uptime, the overall achieved uptime should be measured as 90%. Now that does not mean as a database administrator you should be harsh on your overall goals for uptime. The database server may have still reached a 99.999% uptime. As such, the goal would be met if the five nines were set as the achievement for the year. However, we gauge ourselves on the user’s experience, and that requires an equation that consists of the total over infrastructure from point A to point B for total availability. Point A being the user and point B being the data they request.
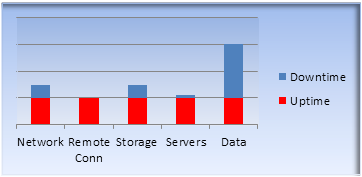
So a better goal other than data availability (point B) would have to take into account major factors that could prevent point B success. A typical landscape would have user (A), network (B), remote connectivity (C), storage (D), other servers (E) and database server (F). Storage does not necessarily mean database storage. This should be any network-related files that ensure business continuity.
Before writing the equation we can define the expected goal of uptime based on the production uptime percentage formula.
Uptime minutes / Planned Uptime * 100 = Uptime %
Planned uptime should always be set forth and well-documented. This is more relevant if the systems are not a 24 by 7 operation. Estimating weekends when no connectivity is required could prove to have a drastic negative impact on the overall uptime. This would involve normal updates to operating systems, database servers, effects from other key system components, and maintenance. Maintenance can be a gray area so plan well. If running something like SQL Server Standard Edition, maintenance on indexes can be a factor in overall planned downtime and uptime. This is due to the time it takes for large indexes to be rebuilt and the data not being available during that time. Without planning uptime, or planned downtime, the objectives can be nearly impossible to estimate.
Now that uptime has been defined and explained, add in the remaining components defined earlier that are required for an overall uptime objective. Let’s assume we planned uptime has been set to allow for 60 minutes of downtime for each component; uptime minutes / 525900 * 100 = Uptime %. Planned uptime minutes = (365.25 * 24 * 60) – 60 = 525900
If we achieved 525800 minutes of uptime, this would mean we achieved 99.98% uptime.
For each component, finding the overall uptime would be done with the following.
((uptime minutes / 525900) + (uptime minutes / 525900) + (uptime minutes / 525900) + (uptime minutes / 525900) + (uptime minutes / 525900))/5 * 100 = Complete Uptime %
If the 525800 was only due to Point B, network outage, this would yield an overall uptime from Point A to Point F of 99.98%. Let’s say that Point B had 525800 and Point F had 525650. Plug these new overall uptime minutes into the equation.
((525800 / 525900) + (525900 / 525900) + (525900 / 525900) + (525900 / 525900) + (525650 / 525900))/5 * 100 = _____%
Break this down (rounding up)
0.99980985+ 1 + 1 + 1 + 0.9995246 / 5 * 100 = 99.987
This achievement tells the team that, together, they met a 99.9% uptime, or three nines. The three nines is an achievement to be proud of as a team. The uptime of the database, Point F, of 99.95% may not be that great in the eyes of a database administrator. But by doing this team mean uptime calculation and reviewing the results, focus points on the data availability can be worked on.
Conclusion and why we want results
Overall uptime goals should always be set and measured for both periods and annual results. These measurements allow bottlenecks to be found and energy to be focused on those bottlenecks for the overall improvement of the mean uptime. Funding for solutions can be proposed in most cases based on hardened facts and clear results by the numbers of how these calculations are done and the bottlenecks uncovered. Without setting goals and measuring them, knowing where we stand can lead to excessive downtime due to the point of failures not being uncovered earlier and resolved proactively.


