


The enhancements to the Activity Monitor were an extremely useful addition to SQL Server 2008. We can gather a moving view of statistics and the health of the instances we connect to. In the real world however, the activity monitor loses value when you need to connect to dozens of SQL Servers in order to obtain that moving feel of each server you manage. There is also the nuisance of being required to open a separate Activity Monitor instance for each server we connect to from SSMS. There is a way we can eliminate those aspects though.
One method we can use is SQL Server Profiler to capture and reuse valuable information gathered from the new Activity Monitor. Profiler allows us to see exactly what is populating the tables behind the engine.
Let’s take a look
Open SSMS 2008 and connect to a development instance. Once open, right click the server name in object explorer and select Activity Monitor from the list.
Now open SQL Server Profiler from the performance tools section located in the all programs section of SQL Server 2008.
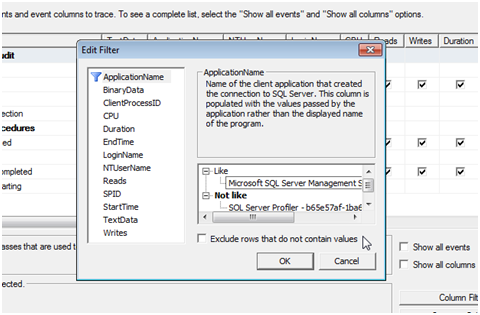
Create a new trace and either save to a table or a file for the output. Saving to a table for this type of task is useful so we can query the results later and will not be a heavy performance issue as the trace will not be running long. Next, click the Event Selection so we can filter out most of the batch statements that we don’t want to see. I put my filter to only show ApplicationName value of “Microsoft SQL Server Management Studio” and also LoginName of myself.
Once that is completely setup, hit Run to start the trace.
You should start to see all of the main statements that are driving the Activity Monitor start coming into profiler.
We can see that the queries are based on several DMV/DMF and are being inserted into temporary tables for the Activity Monitor to show. At this point the query isn’t helpful sense the data is being inserted into temporary tables we cannot control. The temporary tables are already created by the monitor so recreating them manually ourselves would also cause a problem. We can use these queries though to manage our own results by simple changes in them and executing them in tasks we create ourselves.
Let’s show this by grabbing the query that populates the file information in the “Data File I/O” section of the Activity Monitor. The query that does this should look like this in the beginning of the batch
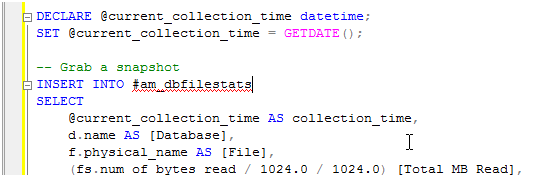
To use this query for ourselves, all we need to do is comment out the INSERT INTO #am_dbfilestats and we can either convert the INSERT INTO to a SELECT INTO statement with our own temporary table or simply use the query as a direct SELECT
SELECT
    d.name AS [Database],
    f.physical_name AS [File],
    (fs.num_of_bytes_read / 1024.0 / 1024.0) [Total MB Read],
    (fs.num_of_bytes_written / 1024.0 / 1024.0) AS [Total MB Written],
    (fs.num_of_reads + fs.num_of_writes) AS [Total I/O Count],
    fs.io_stall AS [Total I/O Wait Time (ms)],
    fs.size_on_disk_bytes / 1024 / 1024 AS [Size (MB)]
FROM sys.dm_io_virtual_file_stats(default, default) AS fs
INNER JOIN sys.master_files f ON fs.database_id = f.database_id AND fs.file_id = f.file_id
INNER JOIN sys.databases d ON d.database_id = fs.database_id;
We can take this even further by using the statements we captured in order to insert data from SQL Server over a time period.
We can already see the value in the information we’ve captured out of Profiler and the Activity Monitor for our own use in reporting and overtime analysis of SQL Server with a rapid development feel to the process.


