


The first stage to tuning a query is the coding. Take a look at the query in listing 1
Note: The query above is utilizing three tables pulled from the database AdventureWorks2012. To create these tables, import them without any indexes into another database. Use a SELECT INTO or any other number of import methods to build the tables.
SELECT
SUM(OrderQty) AS TotalQuantity
,salesman.LastName
,salesman.FirstName
,hdr.ShipDate
FROM
[Sales].[SalesOrderHeader] hdr
JOIN [Sales].[SalesOrderDetail] dtl ON hdr.[SalesOrderID] = dtl.SalesOrderID
JOIN Person.Person salesman ON hdr.SalesPersonID = salesman.BusinessEntityID
WHERE Year(hdr.ShipDate) = 2005
GROUP BY
 salesman.LastName
,salesman.FirstName
,hdr.ShipDate
HAVING SUM(OrderQty) > 10
ORDER BY LastName
Listing 1
The above code is an extract from a mock monitoring system for an internal dashboard display for an inside sales center. Each monitor that is distributed through the sales center displays 5 to 6 charts at any given time showing key performance indicators (KPIs) by customer sales. For the query in listing 1, the KPI that is obtained displays a table and a line chart showing sales per customer, by name, for the current year. Due to a different report showing critical sales pitfalls of any sale that had a quantity less than 10, which has been deemed by the business as a loss due to cost, the query only returns sales with a quantity greater than 10 units.
Figure 2
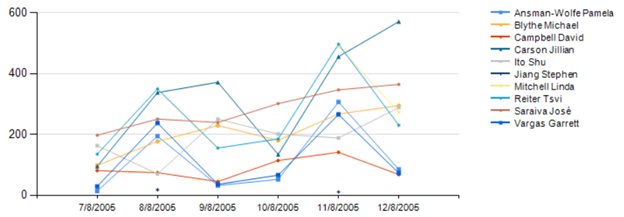
Figure 3
Formatting aside, this chart can quickly show inside sales where to focus on. The associates of the inside sales department focus on this chart when making calls to customers, when they are not seeking new customers.
This type of chart and query are extremely common with this type of visual representation of what is happening in sales. Almost all departments that rely on visual dashboards, either from monitors located around the department or on0demand execution from computers, have these types of charts to help them focus on key areas of business. As data professionals, it is our task to ensure these queries are efficient and the end result, the dashboard, loads efficiently and quickly without any problems.
The Code Tuning Exercise
When code comes across from new development, it is the best time to make changes for best practices and efficiency before it is introduced into a production situation. Let’s look at the query in listing 1.
There are a few things we want to key on
- Sargability
- Sorting and Grouping needs
- Memory allocation needs (cache)
- Index needs
Of course, best practices should always be a task in review for any query review and tuning efforts. We simply cannot go through each bad practice with one query and in one article. What we can do, with most queries, is cover the first 4 steps.
Sargability – Code Changes
Sargable queries come down to search argument capable, or effectively utilizing indexing to minimize time, memory usage and overall consumption of resource like IO to fulfill the query’s needs. This indicates the primary area to review first is the WHERE – the predicates area of the query.

Figure 4
A good rule to go by out of the box is, anything that manipulates the left side of the comparison will indicate a non-sargable situation. In listing 1, the function Year on the column ShipDate to the left, comparing 2005 to the resulting value, causes this to be a non-sargable predicate – a predicate that cannot fully take advantage of indexing. The YEAR() function is used in this example due to the high usage of it just as shown in listing 1. Luckily, there is an effective way to write this in a sargable manner.
WHERE hdr.ShipDate >= '2005-01-01' AND hdr.ShipDate <= '2005-12-31'
Listing 2
Listing 2 shows a method for querying the ShipDate value for all rows that will be a match to the year 2005. By creating the predicates of a ShipDate greater than the 1st of the year and less than the last day of the year, we can effectively search the index instead of scanning the entire contents of the index to fulfill the needs.
Other common non-sargable predicates use LEFT, RIGHT, DATEDIFF, DATEPART and misusing LIKE for wildcard search on the left side of a string parameter.
Sorting and Grouping
Sorting data in a query can be a battle that can be won but is more often lost. The need to sort data is almost always prevalent in data representation. However, where the data is sorted is a key aspect of the data to focus on. SQL Server often sorts very effectively on small volumes of data. However, when data exceeds an estimated memory allocation upon the optimization cycle, the memory needs grows in order to fulfill the queries results. When this happens, sorting is commonly spilled into the tempdb system database. There are several areas that can be focused on when tempdb is involved. One of the most effective is limiting when tempdb is required for these sorting situations.
Take the example below.
Table tempdb_usage has the following schema and contains 2 million rows of data.
CREATE TABLE [dbo].[tempdb_usage](
	[id] [int] IDENTITY(1,1) NOT NULL,
	[bla1] [varchar](36) NULL,
	[bla2] [varchar](36) NULL,
	[bla3] [varchar](36) NULL,
	[SomeDate] [datetime] NULL
)
CREATE INDEX IDX_WEIRDINDEX_USE ON tempdb_usage (bla1)
Note: you can find code to load this table for testing of your own from this LessThanDot forum thread.
Listing 3
The data is as shown in figure 5
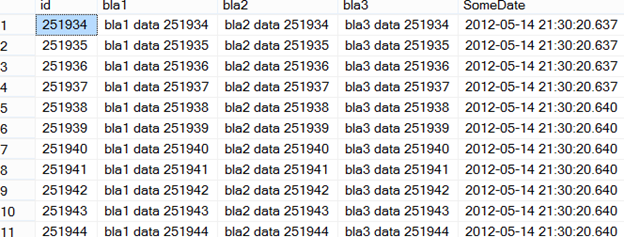
Figure 5
If the following query was executed against this table to return all the rows in column bla1 that are similar to the parameter string of “data”
SELECT bla1 FROM dbo.[tempdb_usage]
WHERE bla1 LIKE 'bla1 data %'
Listing 4
The above query would result in a plan that effectively scans on the index created from listing 3 (in an OLAP situation, this would be acceptable).
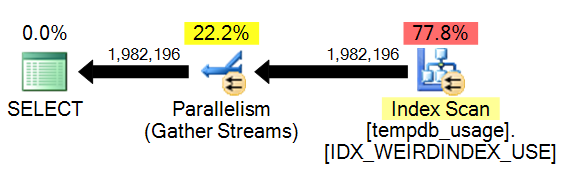
Figure 6
If this were an OLAP setup, the query and resulting plan would typically be acceptable. However, if the reporting needs that caused this query to be written and utilized also required the data to be sorted by columns, the needs of the query would drastically change. To take a close look at what sorting would do to the tempdb utilization to fulfill the query, we can look at sys.dm_io_virtual_file_stats.
SELECT num_of_reads,num_of_writes FROM sys.dm_io_virtual_file_stats(DB_ID('tempdb'), 1)
Listing 5
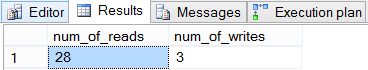
Figure 7
The results above are from the query in listing 4 being executed. To get a good baseline of the tempdb utilization, run listing 4 again and then compare the difference.
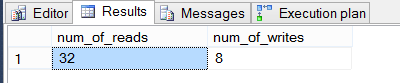
Figure 8
This shows us that tempdb was written to with a factor of 5 given the query from listing 4. Overall, this is a low number and we could live with it on a lot of instances. To show how sorting in SQL Server could drastically change this utilization, execute the query in listing 6.
SELECT bla1 FROM dbo.[tempdb_usage]
WHERE bla1 LIKE 'bla1 data %'
ORDER BY bla2
Listing 6
The first thing to note is the sort operation in the execution plan. In many queries, an ORDER BY may be hard to focus on. In an execution plan, they may stick out a bit more and give a point in the query to refer back to.
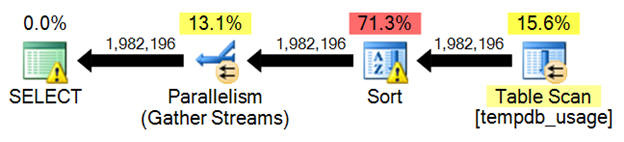
Figure 9
Notice first that the warning indicator of red on the highest cost operation has moved from the index scan and to the sort operation. Now, check the tempdb usage that was needed to fulfill the demand the query has.
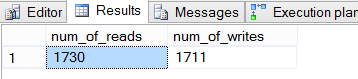
Figure 10
As shown, the use of tempdb when the estimated memory needs of the plan is exceeded is drastic. In a baseline situation, there would be a major spike in tempdb utilization and overall, cause for concern, review or tempdb configuration changes to handle the increased need.
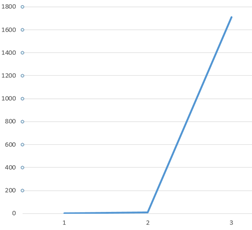
Figure 11
The above query could effectively be sorted in the final tool to eliminate the ORDER BY all together. Reporting Services has its own sorting capability as do most of the other reporting mechanisms used in most enterprise installations. The key is to measure the effects of the reporting tools or services against the needs of SQL Server performing the sorting. You will find that this tuning effort does lend to a 50/50 finding of, 50% will kick back to better performance, even with the tempdb utilization, over the reporting tool’s memory consumption of overall performance of sorting the data at runtime.
Memory allocation needs (cache)
How a query is written and the supporting indexes that are in place to assist in the queries can have a major impact on how many pages are read into memory by SQL Server. Lowering the number of pages needed should always be an area to focus on when tuning efforts are made. This can be done on queries that are not implemented and queries that are monitored in the plan cache of SQL Server by monitoring and creating baselines of the usage over time.
To monitor cached pages, the Cache Pages counter can be utilized. To test a query by tuning it after it is found to be suffering or during review, DMV sys.dm_os_buffer_descriptions and sys.indexes catalog view can be utilized. Refer to “Adding nonclustered index on primary keys” for a query that is used in the results for pages allocated in figure 12.
Executing the query from listing 1 results in the following buffer allocations
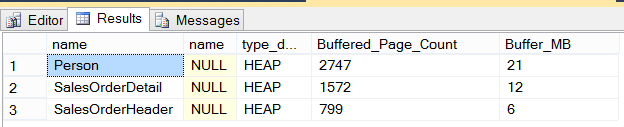
Figure 12
At this time, no indexing has been performed on the tables the query is reading. This results in 3 HEAP tables and an overall consumption of 39MB of the buffer.
The next step to perform in the tuning efforts would be to effectively lower the pages that are read into the buffer. This is done by effective indexing and by the methods we’ve already covered. Since indexing can single-handedly have the most impact on performance, that is what we will cover next. While working through indexing the query in listing 1, we will monitor the pages allocated and refer back to this section to show how indexing efforts not only enhance the speed of the query but, lower the complete resource consumption on the SQL Server entirely.
Indexing
As stated, indexing can have the highest impact on performance for a SQL Server instance. This is because, indexing can restrict the needs for resources by limiting the volume of resources needed to fulfill a query. This includes IO, Memory and CPU utilization. Each resources relates to the other in terms of, when IO is high, CPU is effected and the same can be said about memory.
In listing 1, the following actual execution plan is generated by the optimization process in SQL Server.
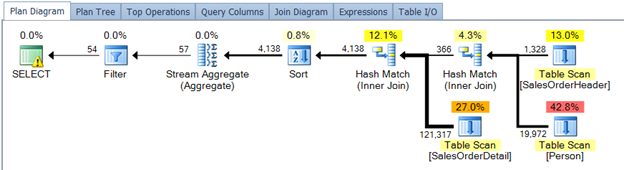
Figure 13
Note: Plan Explorer Pro is utilized in all the execution plan and tuning efforts shown in this article. This tool is also available in a free version from SQL Sentry. The pro version is highly recommended and an asset to tuning.
Some high cost operations that can be identified quickly in any execution plan are
- Physical Join – hash, merge, nested loop poorly used)
- Table scans
- Index scans
- Table Valued Functions
- Sorts
- Lookups
The above 6 operations are a great place to start when tuning by execution plan use. In listing 1 and the execution plan generated, three table scans are quickly identified. These three table scans can be eliminated by indexing both the predicates and the output lists. This is known as creating a covering index. A covering index is an index that completely fulfills the needs of the query by covering the search arguments (predicates) and the columns that are to be returned by the query.
Look at the table scan on SalesOrderHeader
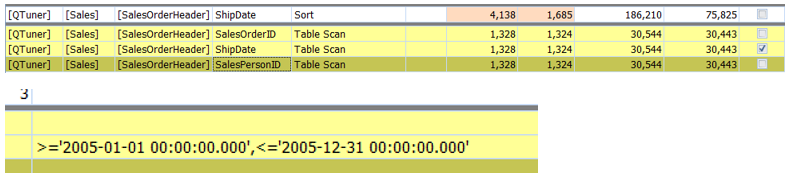
Figure 14
The scan contained a sort on ShipDate and then SalesOrderID and SalesPersonID with a filter on ShipDate. This tells us all we need to create an effective index on SalesOrderHeader.
Some basics of index creation: Columns in an output list are typically better suited for a nonkey area or the INCLUDE. Foreign keys (FK) or keys used as JOIN criteria should be indexed but can be part of the index key columns if they fulfill the covering index concept. In most cases, FK indexes should be created at all times to ensure efficient use in queries. Predicates or, for Plan Explorer, filters, should be in the key column listing and in many cases, can be ordered as they fall in the predicates ordering.
With these basic steps, the following indexes can be created.
CREATE CLUSTERED INDEX IDX_SalesOrderID ON Sales.SalesOrderHeader (SalesOrderID)
CREATE NONCLUSTERED INDEX IDX_SalesPersonID ON Sales.SalesOrderHeader (SalesPersonID)
CREATE NONCLUSTERED INDEX IDX_COVER_HEADER ON Sales.SalesOrderHeader (ShipDate)
INCLUDE (SalesOrderID, SalesPersonID)
Listing 7
Execute the query from listing 1 again in Plan Explorer and review the results from our index creation
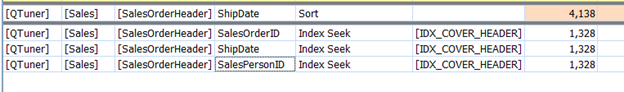
Figure 15
Checking the page allocation and how it has changed from our initial results, we can see that the FK indexes are utilized as well as the new index.
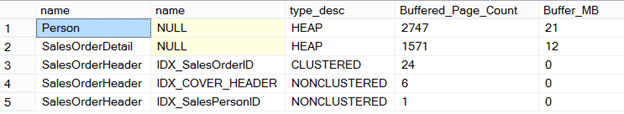
Figure 16
Recall prior in figure 12, the HEAP and resulting pages pulled into the buffer were 799. This has now been reduced to a total of 31 for SalesOrderHeader. As well as the buffered page count being tuned, the execution plan generated has also been tuned for SalesOrderHeader.
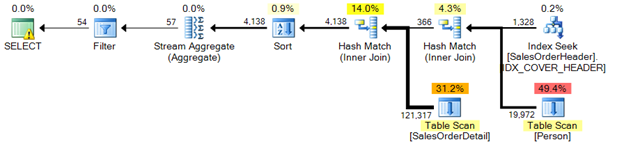
Figure 17
Following the same effective steps to create indexes, cover the remaining table scans from the figure 18.
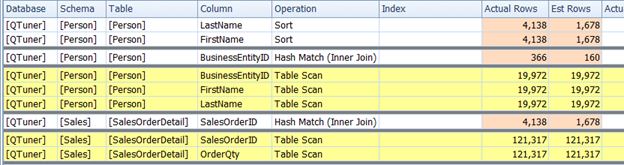
Figure 18
Person.Person
CREATE CLUSTERED INDEX IDX_BusinessEntityID ON Person.Person (BusinessEntityID)
CREATE NONCLUSTERED INDEX IDX_FirstLastName ON Person.Person (FirstName,LastName)
Figure 19
Sales.SalesOrderDetail
CREATE CLUSTERED INDEX IDX_SalesOrderID_DTL ON Sales.SalesOrderDetail (SalesOrderID)
CREATE NONCLUSTERED INDEX IDX_OrderQTY ON Sales.SalesOrderDetail (OrderQTY)
Figure 20
Plan completion after indexing
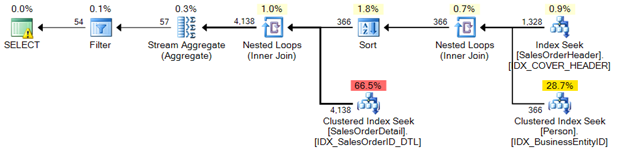
Figure 21
The final step will be reviewing the buffered pages again to ensure the query is utilizing as little resources as needed at this time.
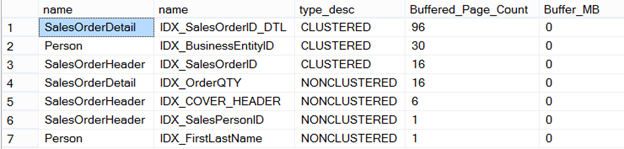
Figure 22
Summary
With all the tuning efforts that are made with today’s high-volume databases, indexing and coding best practices are still an extremely effective and important first stage for ensuring resources are utilized effectively. Best practice coding standards such as writing sargable queries can ensure coding efforts prove the efficiency they have to offer while returning mission critical data. Finally, while indexing, monitoring buffer and extending to resource needs, should be done on even the simplest queries.
Using these steps in their basic form is almost a daily review of any SQL Server and database resource. Although many other tuning areas are to be performed such as IO subsystems configurations, memory expansion and types as well as CPU expansion while taking into account altering and setting SQL Server configurations as needed, indexing and what has been covered today still remains the highest impact areas of the relational database.


