In my last post, “Baseline, Performance Reporting and being a proactive DBA”, I touched on baselines and using them to set thresholds for actively monitoring performance problems on SQL Server. I briefly discussed that every database server is unique when the databases we attach to SQL Server are packaged installations from third party applications (like SAP, Dynamics etc…). I received feedback from my good friend Aaron Lowe (Twitter | Blog) on this topic and had a very good conversation on how we create these baselines. Aaron had a great point regarding there not being much out there on exactly how to do this so I thought I’d write up a follow-up to the article and some points you can use to create your own baselines.
So why aren’t there a ton of posts on creating baselines?
Here are my two bits on the topic. Creating a baseline is almost as unique as every business and processing model. In saying that, creating a baseline and what you capture will vary slightly. A lot of variables like the hardware you’ve purchased, the storage type, the server technology, OS versions/editions and even SQL Server editions affect the process. Even with these variables and the unique nature of business, we can set some guidelines of where to start and how to make our baseline.
Baseline creation basics
The most important thing to understand when creating a baseline is, the collection of the baseline itself will affect performance of the SQL Server and Operating System. Given that factor, take into account that using tools to collect how the resources are being utilized will affect the overall outcome.
Another important factor to think about; baseline creation is not tuning time. Your tuning should be done as its own major task. It should also be done prior to baseline creations. If you create a baseline based on an un-tuned database server, the baseline will be inaccurate before it is even put to use. The baseline will be far above the levels that you reach after tuning and true spikes in performance and progressive problems can easily go on without being caught.
Performance Monitor (perfmon) is a tool that you can use not only for baseline capture but for overall performance for long term monitoring. At this time I would not recommend the use of profiler in your baseline. The reason for that is, profiler has a large impact on performance. Even in a lot of troubleshooting scenarios, perfmon would be utilized first to identify the bottlenecks. Then profiler can be used as a focused tool to dig out the root causes.
Dynamic Management Views/Functions
With the addition of Dynamic Management Views in SQL Server 2005+, we have a completely new way to add to baseline capturing. sys.dm_os_performance_counters alone gives us a vast amount of information to work off of that was only available to perfmon. To see the types of counters that are exposed in performance_counters, use the following query
SELECT DISTINCT [object_name]
FROM sys.[dm_os_performance_counters]
ORDER BY[object_name];
In the list of counters you will see there are quite a few SQL Server counters that we can analyze. The only problem is everything in there is restricted to SQL Server. This means we will still need the help of perfmon and other tools like WMI reads. I mention Windows Management Instrumentation (WMI) because my own baseline capture process consists of some WMI reads similar to the methods that Jason Massie uses here and using the WMI reader task in SSIS. WMI can get deep into the hardware and give us information so we can refine our baselines down even further.
Perfmon counters to include in the baseline
The counters to use in perfmon are out there already from a BOL entry on Windows 2003 and SQL Server. The only variation to this listing that I deviate from is the deadlock and log growth counters. I feel these should be already tuned and configured so they would not be a common problem. Instead, they are counters to monitor over the long time period of time for active notification. With the introduction of Event Notification and Extended Events, even these counters are not as commonly used any longer. If you find that deadlocks are a problem, your baseline capture should stop and the deadlocks resolved before going on. Deadlock, blocking or queries not tuned should not be allowed into your baseline.
Putting it all together
SSIS has much more to it than being an ETL product. With baseline capture tasks, we can use it as our container in order to periodically execute the collection of information we can then set our baseline off of.
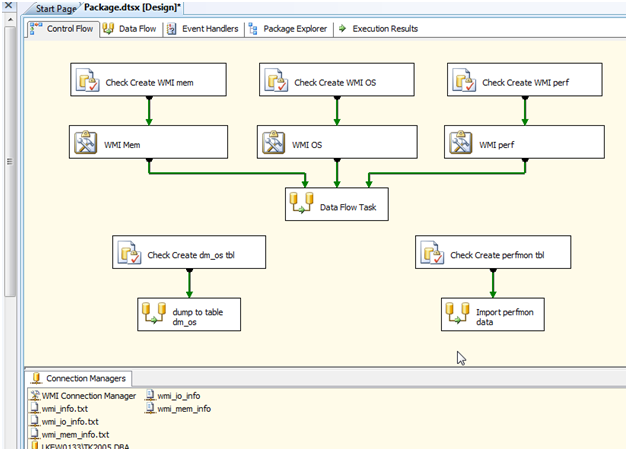
Take the following example to start from

In this control flow we can see WMI reader tasks executing to collect OS, IO and Memory information. This all then goes into a DBA database and tables to collect the data over time.
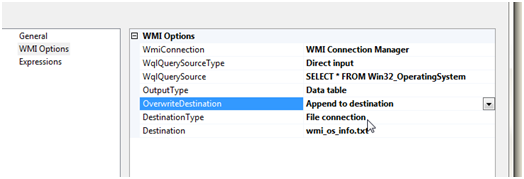
Note: before going on, let’s talk about WMI reader task. WMI reader task exposes WMI to read in and directly into a flat file or variable. I like to use the flat file option to minimize memory usage so when doing this, ensure you “append” to the files and not leave the default, Keep original

Executing all of the WMI reads then sets them into a Data Flow task that will consume the files, convert the data types and import them into a SQL Destination.

Collecting perfmon will already have a set file given the perfmon setup done outside of SSIS. I recommend going over to Brent Ozar’s (Twitter | Blog) blog on perfmon setup. It’s detailed and well drawn up to get collection of the information going.
Last, but definitely something that makes this easier, the execution of dm_os_performance_counters. Since this DMV does not have a timestamp associated with it, add getdate() to the select so you can successfully pivot the data and read it for later use.
Note: the SQL Server counters are all available in perfmon as well. If executing the DMVs become longer of an execution time than adding them to the perfmon collections and reading the flat file. This frees SQL Server resources and allows the baseline to be more accurate. Don’t restrict to this DMV as well. This is an example. The memory related DMVs and on is all valuable information.
Once all of this data is collected, SSRS can be used to analyze where your systems are leveling off. All spikes of noticeable problems should be resolved and then a time based baseline capture performed once again. This cycle should go on until a true baseline is captured.
Once the baseline data is collected (typically a week during all hours of operations) you can make decisions on specific thresholds in which an alert should be sent notifying you of a warning or critical event.
Estimating, requesting and begging for more
When creating a baseline and then further estimating the resources you need to maintain that level of performance, overestimating is your best friend. There is a reason when you ask a DBA, “How much disk space do you need?” you will always be given the answer, “All of it”. This is because, before the database server is set in place and growth analytics have been collected, we’re planning for the worst and fastest growth path. There is nothing wrong with that method of going about resources other than budget planning.
Baseline should give you the starting point to also base your reporting performance over time and estimating resources required for growth and scaling the database server.
Once all of this information is collected, thresholds are set and you know where you stand with your database servers, you will be able to make confident and precise decisions on what the systems are capable of doing for the business and when there is a need for improvements or upgrades.
The meat of third party tools
Now that we have shown we can do all this work on our own, we can’t end without mentioning the tools that are out there to help us accomplish the same thing. Anyone that has read my articles in the past knows that I am an advocate for being a lazy DBA. This really has nothing to do with being lazy but means using everything and anything in order to make our jobs more efficient. SSIS is great and something I’ve taken on full speed since SQL Server 2005.
With that said, Quest, Red Gate, Idera and a few others have this capability in their products. Idera SQL Diagnostic Manager in the newer version has a baseline option that captures performance at a time requested and sets thresholds to it. Quest and the others have similar baseline functionality.
These third party tools make life easy but more importantly, get the job done quicker and with much less human error involved. I highly recommend if the budget is there and you can convince the decision makers of the value in them, purchase one of them that fits your environment.
Still no go on the money for those nice tools and development time? Performance Dashboard Reports have been around since SQL Server 2005. These reports are valuable as canned reports that read from various DMV/DMFs and give you a snapshot of the SQL Server as it is when executed. OS metrics, Index usage, CPU, IO, user activity…and more is covered. The dashboard installs right into your SSRS instance. I personally have this setup for some database servers where a license of my other monitoring tools is not worth the cost based on the noncritical business aspect of the particular server. (the package will be cleaned up and posted to this blog at a later date for download) I send subscriptions with Excel representations of the reports at time of executed. I save these then for a month or so and can analyze normal vs. abnormal performance. This information can be taken and a baseline formulated from it as well.
SQL Server 2005 and 2008 also have the Server Dashboard as part of the canned reports that can be run from SSMS.

This is all very useful and valuable information about the state of your SQL Server and the databases.
Conclusion or what we call, take away
Baseline information can take some work to collect. The information we collect is critical to allowing us to make decisions on when problems are out of the normal day to day scope. We can collect true growth and progressive resource usage and base that on educated and precise decisions for upgrading to more advanced and larger hardware when the time comes.


