This is my first blog, so please go easy one me.
So from what I’ve seen a lot of companies tend to need to see hierarchical data in a report, or see data in a hierarchical structure in a report. Usually the best and most simple way to display this data is a drill down report. For the purposes of this blog I’m going to act as if the reader hasn’t used SSRS before but has used Sql Server 2005 and some knowledge in TSQL.
A drill down report starts with a higher level set of data (overview) and allows you to “drill down”, or move through, the data into lower levels, getting into more specific details as you go.
So to start, we’ll need a set of data. Just so that we’re on the same page lets create the following stored procedure.
CREATE PROCEDURE dbo.DrilldownExample
	-- Add the parameters for the stored procedure here

AS
BEGIN
	-- SET NOCOUNT ON added to prevent extra result sets from
	-- interfering with SELECT statements.
	SET NOCOUNT ON;

    -- Insert statements for procedure here

declare @table table (ProductType nvarchar(20), ProductName nvarchar(50), ProductCost decimal(20,4), CustomerName nvarchar(50), Quantity int, PurchaseDate datetime)

insert into @table values ('Video Game', 'Halo 3', 50, 'Bob Dylan', 4,'4/1/09')
insert into @table values ('Video Game', 'Halo 3', 50, 'George Allen',1,'4/1/09')
insert into @table values ('Video Game', 'GTA4', 50, 'George Allen',1,'4/7/09')
insert into @table values ('Video Game', 'Super Smash Brothers', 25, 'George Allen',1,'1/28/09')
insert into @table values ('Console Accessorie', 'Xbox 360 Controller', 50, 'Bo Peep',3,'4/27/09')
insert into @table values ('Console Accessorie', 'PS2 Memory Card', 15, 'Steve Hobs',2,'4/27/09')
insert into @table values ('Music CD', 'Psychostick - We Couldnt Think of a Title', 10,'Dave Westcalf',1,'4/27/09')
insert into @table values ('Music CD', 'Now 1', 5, 'Gill Bates',1,'3/22/09')
insert into @table values ('Music CD', 'Now 2', 5, 'Gill Bates',1,'3/22/09')
insert into @table values ('Music CD', 'Now 3', 5, 'Gill Bates',1,'3/22/09')
insert into @table values ('Music CD', 'Kidz Bop 1', 5, 'Gill Bates',1,'3/22/09')
insert into @table values ('Network Gear', 'Ethernet Cable - 05ft', 10, 'William Bonk',10,'4/27/09')
insert into @table values ('Network Gear', 'Ethernet Cable - 10ft', 20, 'William Bonk',15,'4/27/09')
insert into @table values ('Network Gear', 'Ethernet Cable - 20ft', 35, 'Bob Dylan',8,'4/1/09')
insert into @table values ('Network Gear', 'Ethernet Cable - 20ft', 35, 'Bob Dylan',8,'2/18/09')
insert into @table values ('Network Gear', 'Ethernet Cable - 05ft', 10, 'Karen Chase',2,'4/27/09')
insert into @table values ('Network Gear', 'Linksys 4 Port Router', 55, 'Bob Dylan',2,'4/1/09')
insert into @table values ('Network Gear', 'Linksys Wireless Network Adaptor', 68, 'William Bonk',5,'4/27/09')
insert into @table values ('Network Gear', 'NIC Card', 15, 'William Bonk',7,'4/27/09')
insert into @table values ('Computer Hardware', '80GB Harddrive', 60, 'Lisa Smith',2,'4/27/09')
insert into @table values ('Computer Hardware', '20in LCD Monitor', 120, 'Lisa Smith',1,'4/26/09')

select
	ProductType,
	ProductName,
	ProductCost,
	CustomerName,
	Quantity,
	PurchaseDate
from @table
order by
	ProductType,
	ProductName,
	CustomerName,
	PurchaseDate

END
GO
I like to run my reports off of stored procedures. To me it’s easier because if I need the same data for a different report I can just use the same sp.
Alright, now that we know where we’re pulling the data from, let’s open up Visual Studios. Create a new report project (file – new – project. Business Intelligence Projects, Report Server Project). You can name it whatever you want, I’m going to name it BasicDrillDownExample.
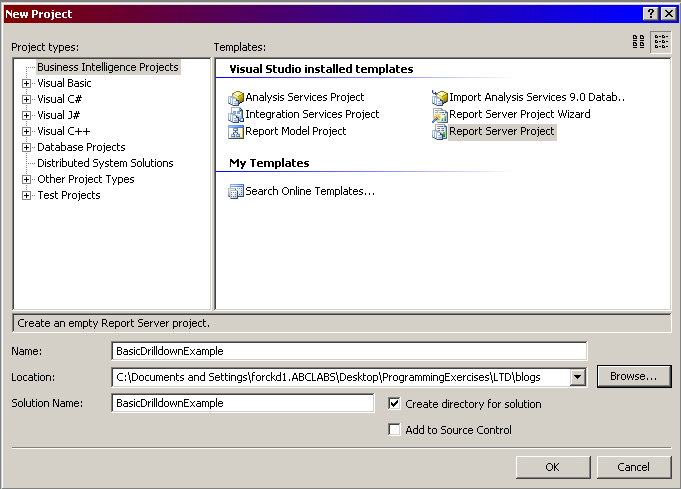
Now we need to create our Data Source. The data source is the database and server we’re going to use to access our data. Right click the Shared Data Sources folder in the Solution Explorer Window and click Add New Data Source.
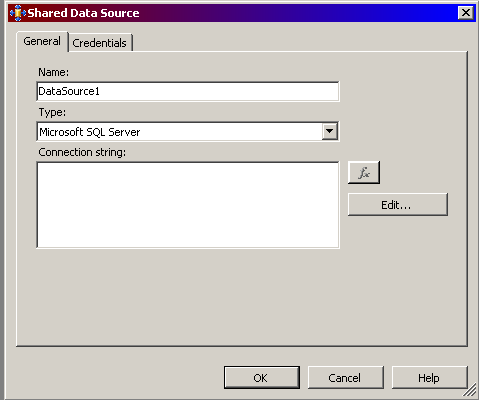
Click the Edit Button
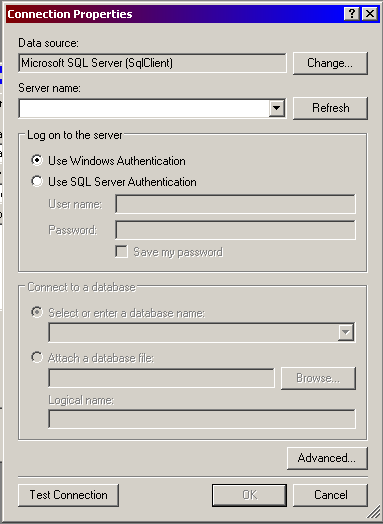
In the first dropdown list, select the server you saved the sp on. In the database dropdown list, select the Database where the sp is. Click ok.
Now at this point I would set up the Credentials so that when I deploy it the users that I want to use it can. Right now we’ll just deal with creating the report and deal with deploying reports to SSRS at another time.
Don’t forget to give your data source a meaningful name. I usually put the Server Name and Database name as the name.
Click OK. Your data source should now show up in the Solution Explorer.
Right click the Reports folder – click add – click new item. We’re doing it this way because we don’t want to go through the wizard. Click on Report and name the report Drilldown Example. Click Add.

The report should now show up in the solution explorer window, and the report should be open now (if not, double click the report in the solution explorer window)
If not selected, click the Data tab. Click the Dropdown Box next to Dataset and click New Dataset.

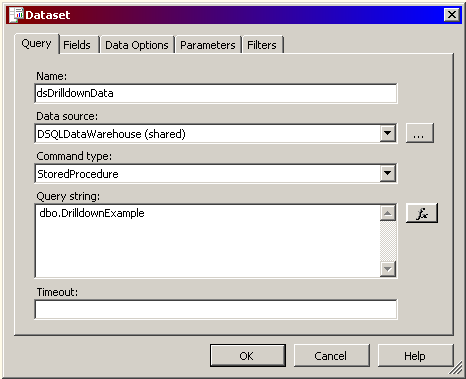
Name the Dataset dsDrilldownData. The Data Source should be the one we just created. The command type needs to be stored procedure. In the Query string type dbo.DrilldownExample. Click Ok.
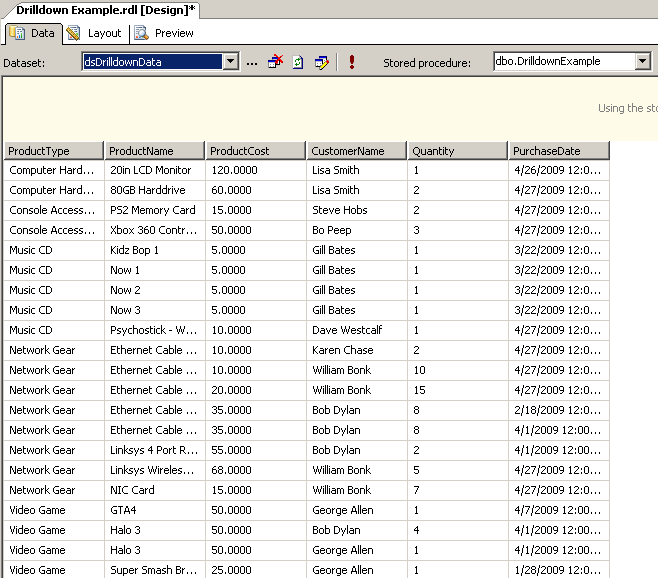
Click the Exclamation mark to execute the query to make sure it works.
Now we’re ready to get our hands dirty. Click the layout tab. Drag a table control from the Toolbox. Expand the dataset (dsDrilldownData) in the Dataset window. In the header of the first column type Product Type. In the header of the second column type Product Name. In the header of the third column type Customer Name.

From the dataset list, drag ProductType onto the detail box below the column header. Repeat this for ProductName and CustomerName. These will be are three groups of the report.

Click on the table to see the gray bars on the top and side of the table. Right click the gray box on the top left of the table, and click properties. The table properties box will pop up. Click the Groups Tab. Click Add.
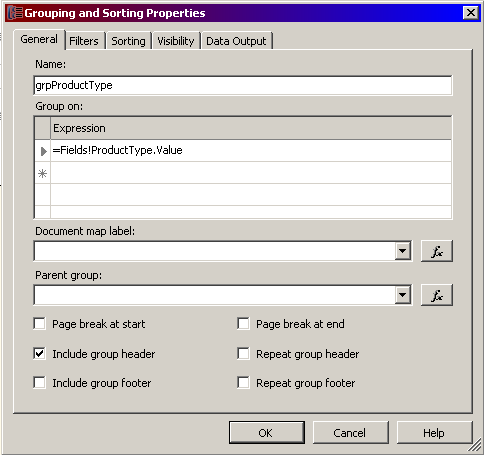
Name the group grpProductType. In the expression list select =Fields!ProductType.Value. Click the Include group footer to deselect it. Click OK.
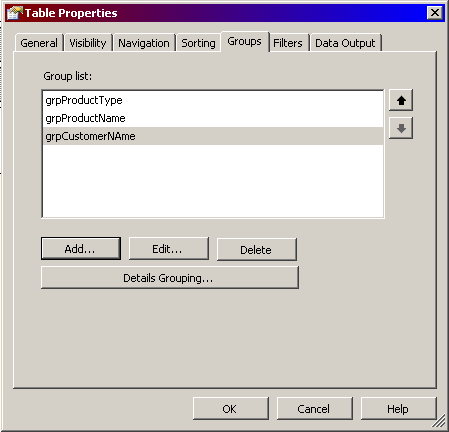
Repeat the same process for ProductName and CustomerName. Once all three are done, make sure they’re in the same order as the image.
Click ok. Three rows will have been added, one for each group you created. The group number corresponds with the order of the groups in the group list. Since the Product type should be the first group, click the box and drag the field to where it’s sitting in the row for group one. Product name belongs to group two, so drag it up to the second row. Customer Name is group 3 so drag it to the third row.
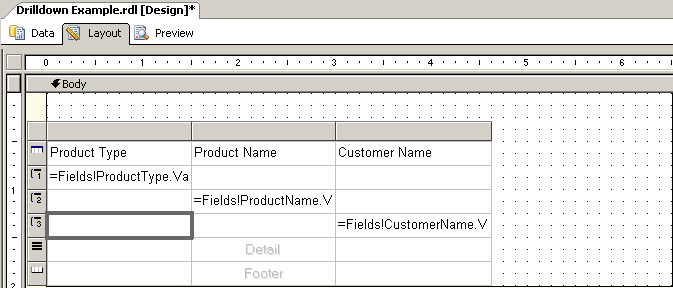
We aren’t going to use the bottom 2 rows, so highlight them by click the gray box next to them and hitting the delete buttom.
Let’s go ahead and preview button. As you can see we have data, although it’s very ugly and there’s not a lot there to really tell us anything. Let’s go back to layout view.
Right-click the gray box above the product name column and select Insert Column to Right. A new column will appear. Now we have room to add some data to the product name group. Click and drag the ProductCost field onto the group 2 row of the new column. As you can see, VS automatically adds a sum function to any number data when added to a group. Also notice that it went ahead and filled in Product Cost as the column header.

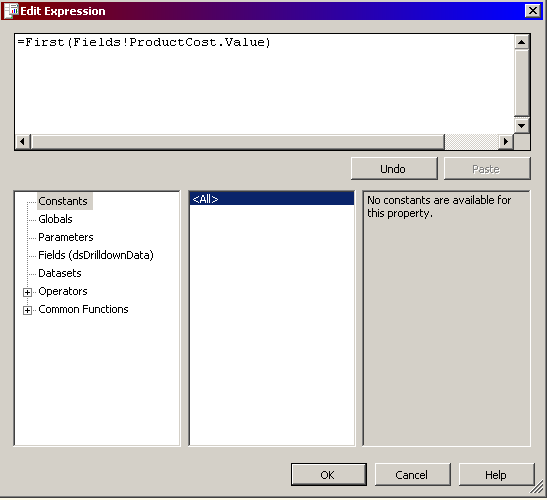
Product Cost doesn’t need to be summed; instead we want to return the first value for it since it will be the same for the same product. So to change this we will right-click the field and click Expression. Replace the word Sum with the word First. The First function will return the first value it finds. Click ok.
Add a column to the right of Customer Name. Add the quantity field to the CustomerName group. Keep the sum function because this time we want to total the number of products a customer has bought.
Right now if we preview the report we’d have a decent amount of data, but it would be very ugly and somewhat. We’re going to make it a bit easier to read. We’re also going to set up the actual drill down ability.
Click and drag on the gray boxes to the left to highlight all of the rows. In the Properties Window click Border Style and Click Solid. Select the Header row. In the Properties Window click BackgroundColor and click Gainsboro.
Click the Group One row and give it a color. Repeat this with the other two rows, so that you have distinguishing colors for each group.
You should end up with something like this:

Now to set it up so that we can collapse and expand the groups. Right click the table and go to properties. Click the groups tab. Select the grpProductName group and click edit. Click the Visibility tab. Click the hidden radio button. Click the Visibility can be toggled… check box. In the drop down list click ProductType (the name of the box the product type field is in, automatically named when we dragged the data onto the table). Click OK.

Repeat the same process for grpCustomerName, but select ProductName in the dropdown list.
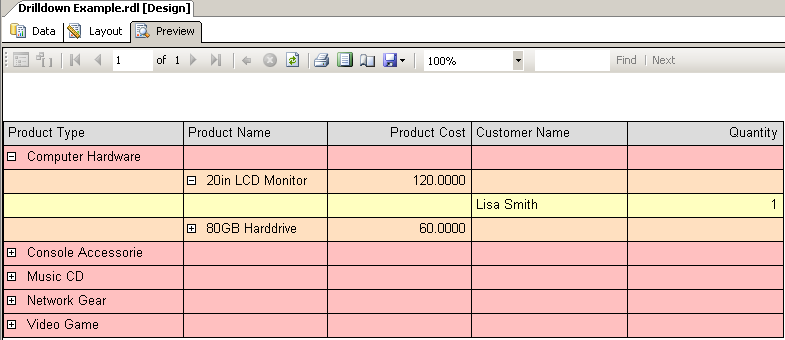
Now our report should be ready! Click preview. The report should load. Next to each product type you should have a plus sign that you can click to drill down. Congrats, you’ve made your first drill down report. If the report doesn’t work, go back and make sure you followed every step.
