This post is about stats from hits to this website. I always find this interesting because you can get a feel of what is moving and shaking in the tech industry. Of course the stats on this site are heavily skewed towards technology and although this site is small compared to something like reddit or del.icio.us we still get millions of hits a year so it is not a sample of 10 hits 🙂
Smart phones

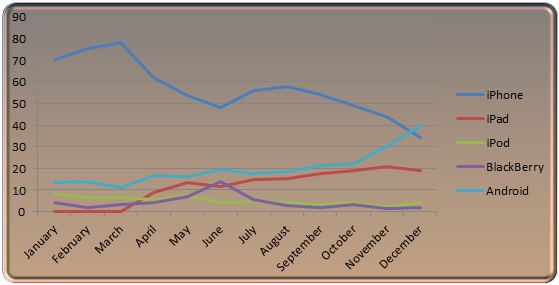
As you can see from that chart, in January iPhone was at 70% and it ended up in December at 34%, Android went from 13% to 40%, Android activations are almost double now compared to Apple’s in the last quarter. My predictions is that Android will have at least 55% share by the end of next year. It is not all doom and gloom for Apple however, the iPad managed to rise to almost 19% since April. Below are the numbers that were used to generate the chart.
| Month | iPhone | iPad | iPod | BlackBerry | Android |
|---|---|---|---|---|---|
| January | 70.34 | 0 | 8.31 | 4.04 | 13.26 |
| February | 75.5 | 0 | 6.71 | 2.01 | 13.76 |
| March | 78.21 | 0 | 6.32 | 3.27 | 11.11 |
| April | 61.79 | 8.67 | 5.42 | 4.34 | 16.53 |
| May | 53.74 | 13.54 | 7.27 | 6.87 | 16.16 |
| June | 48.28 | 11.52 | 4.17 | 13.73 | 19.61 |
| July | 55.92 | 14.88 | 4.85 | 5.52 | 17.7 |
| August | 57.95 | 15.5 | 4.15 | 2.74 | 18.64 |
| September | 54.3 | 17.66 | 3.12 | 1.93 | 21.22 |
| October | 49.18 | 19.04 | 4.05 | 3.27 | 22.05 |
| November | 44.04 | 20.78 | 2.49 | 1.57 | 30.29 |
| December | 34.44 | 18.89 | 4.31 | 1.81 | 40 |
Browsers

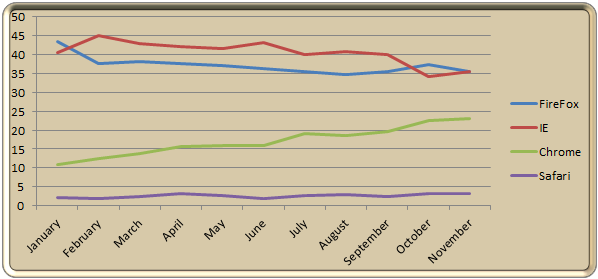
The year 2010 was a very good year for Chrome, Chrome has more than doubled its share, FireFox lost about 8% and IE lost about 5%. Now that Chrome has a lot of the Extensions that FireFox has I think even more people will switch to Chrome, I have been using Chrome since the first beta version and have never gone back to fireFox or IE. My predictions is that Chrome will capture a third of the market by the end of next year.
Below are the numbers that were used to generate the chart.
| Month | FireFox | IE | Chrome | Safari |
|---|---|---|---|---|
| January | 43.47 | 40.64 | 10.81 | 2.25 |
| February | 37.59 | 45.16 | 12.6 | 1.87 |
| March | 38.29 | 42.89 | 13.73 | 2.36 |
| April | 37.57 | 42.03 | 15.57 | 3.07 |
| May | 37.06 | 41.67 | 15.88 | 2.77 |
| June | 36.18 | 43.14 | 16 | 1.97 |
| July | 35.6 | 39.89 | 19.09 | 2.61 |
| August | 34.68 | 40.82 | 18.67 | 3 |
| September | 35.44 | 40.1 | 19.69 | 2.32 |
| October | 37.46 | 34.09 | 22.48 | 3.19 |
| November | 35.6 | 35.59 | 23.08 | 3.11 |
| December | 35.77 | 35.22 | 23.03 | 3.12 |
Internet Explorer

Internet Explorer 6 is slowly going to below 5% share, IE8 is the most used browser with almost 70% share. I tried IE 9 a couple of times, I like the speed and the other improvements it has but it won’t be enough to make me switch from Chrome
Below are the numbers that were used to generate the chart.
| Month | IE8 | IE7 | IE9 | IE6 |
|---|---|---|---|---|
| January | 52.88 | 31.87 | 0 | 15.18 |
| February | 53.22 | 31.25 | 0 | 15.52 |
| March | 56.31 | 29.84 | 0 | 13.8 |
| April | 61.6 | 24.93 | 0 | 13.41 |
| May | 62.01 | 24.54 | 0 | 13.5 |
| June | 62.3 | 24.86 | 0 | 12.75 |
| July | 65.56 | 22.8 | 0 | 11.6 |
| August | 67.24 | 22.01 | 0 | 10.72 |
| September | 65.73 | 22.72 | 1.52 | 10.03 |
| October | 66.48 | 21.9 | 3.27 | 8.3 |
| November | 68.8 | 19.87 | 3.68 | 7.62 |
| December | 69 | 20.28 | 3.07 | 7.63 |
Windows

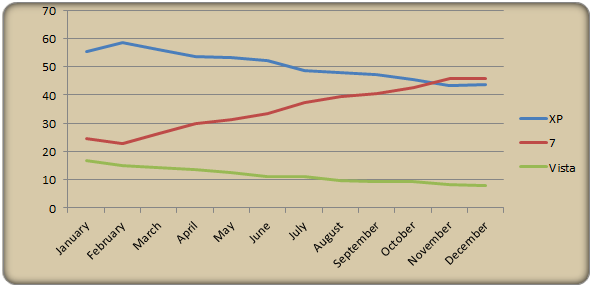
Windows 7 has been the most used version of windows for the past two month on this site. XP is still going strong..especially in corporations. Vista’s share dropped in half.
Below are the numbers that were used to generate the chart.
| Month | XP | 7 | Vista |
|---|---|---|---|
| January | 55.48 | 24.39 | 16.6 |
| February | 58.69 | 22.85 | 14.99 |
| March | 55.91 | 26.15 | 14.38 |
| April | 53.6 | 29.85 | 13.43 |
| May | 53.12 | 31.17 | 12.65 |
| June | 52.22 | 33.38 | 11.23 |
| July | 48.73 | 37.25 | 10.94 |
| August | 47.77 | 39.52 | 9.68 |
| September | 47.17 | 40.43 | 9.38 |
| October | 45.45 | 42.45 | 9.49 |
| November | 43.25 | 45.88 | 8.21 |
| December | 43.74 | 45.7 | 8.08 |
That is it for this post…what are your predictions for the next year…what will Chrome, Android and iPad end up at. What about windows phone 7..will that platform have a chance? Let me know in the comments…


 Denis has been working with SQL Server since version 6.5. Although he worked as an ASP/JSP/ColdFusion developer before the dot com bust, he has been working exclusively as a database developer/architect since 2002. In addition to English, Denis is also fluent in Croatian and Dutch, but he can curse in many other languages and dialects (just ask the SQL optimizer) He lives in Princeton, NJ with his wife and three kids.

