


Introduction
Yesterday I started using jquery datatables and today I will play some more. I did this blogpost using jtable before. And now I’m gonna try the same thing and maybe a little more using datatables.
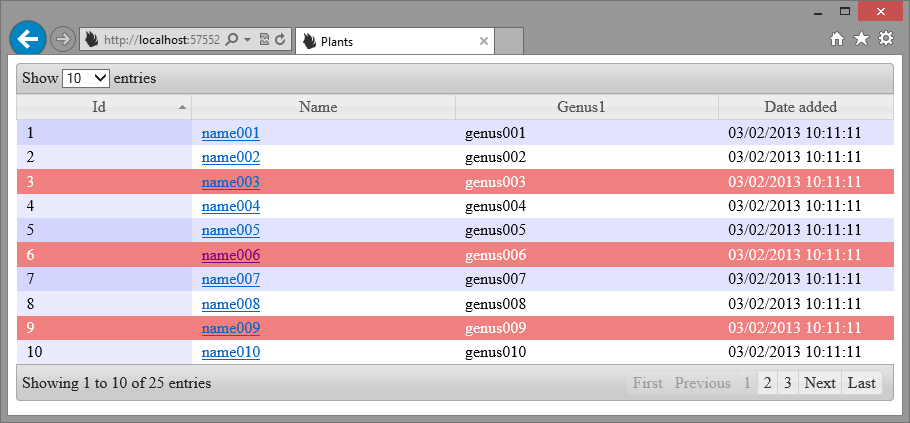
This should be the result if everything goes well, which it never does from the first time, because Murphy is pairing with us.
Isn’t it purdy?
Ok it isn’t but it works.
Adding a link
Making a column linkable is as easy as it was in jtable.
In our aoColumns definition we just use mRender which takes a function.
{
                        "mData": "Name", "sTitle": "Name", "sWidth": "30%", "bSortable": false,
                        "mRender": function (data, type, row) {
                            return '<a href="/plants/' + row.Id + '">' + data + '</a>';
                        }
                    }```
So data is the data for that cell, row is the object (in our case, could be an array too if your json datasource returns an array of arrays) and type is… not yet found a use for that.

## Formatting our dates with time

As far as I can tell datatables has no way to format dates built in like jtable did. So we jump straight to moment.js.
{ “mData”: “DateAdded”, “sTitle”: “Date added”, “sWidth”: “20%”, “bSortable”: false, “mRender”: function (data, type, row) { return moment(data).format(‘DD/MM/YYYY HH:mm:ss’); } }``` Don’t forget to add the moment.js nuget and import the moment.js file.
Color a row based on something
In Excel they call this conditional formatting. In the example above I made all the rows lightcoral where the id was divisable by 3.
My first attempt was this.
"fnRowCallback": function( nRow, aData, iDisplayIndex, iDisplayIndexFull ) {
                    if ( aData.Id % 3 == 0 )
                    {
                        $(nRow).css('background-color', 'lightcoral');
                        $(nRow).css('color', 'white');
                    }
                }```<div class="image_block">
  <a href="https://lessthandot.z19.web.core.windows.net/wp-content/uploads/users/chrissie1/nancy/nancydatatables3.png?mtime=1359883342"><img alt="" src="https://lessthandot.z19.web.core.windows.net/wp-content/uploads/users/chrissie1/nancy/nancydatatables3.png?mtime=1359883342" width="910" height="423" /></a>
</div>

And that is not the desired result because someone is overriding my nice formatting with their own on a td level, bad, bad people.

But I can be mean too. And this will work.
“fnRowCallback”: function( nRow, aData, iDisplayIndex, iDisplayIndexFull ) { if ( aData.Id % 3 == 0 ) { $(’td’, nRow).css(‘background-color’, ’lightcoral’); $(’td’, nRow).css(‘color’, ‘white’); } }```
Conclusion
It’s fairly easy to bend the data to your will and format things as you desire.
 Chris is awesome.