


In yesterday’s post we looked at Searches, Countries and Content. Today we are looking at Devices, Operating Systems and Browsers. Microsoft came out with a new operating system at the end of October. during the month of December, Windows 8 accounted for 7.88% of all Windows visitors. We’ll have to see how long it will take before Windows 8 passes Windows XP.
Mobile Devices
This table list all the mobile devices that accessed this site aggregated over the whole year. No surprise, the iPad is number 1, the iPhone is number 2
| Mobile Device Info | Percentage |
|---|---|
| Apple iPad | 32.13% |
| Apple iPhone | 26.50% |
| (not set) | 10.76% |
| SonyEricsson LT15i Xperia Arc | 2.92% |
| Samsung GT-I9100 Galaxy S II | 2.27% |
| Nokia Lumia 710 | 2.02% |
| Samsung Galaxy Nexus | 1.97% |
| Apple iPod Touch | 0.95% |
| HTC Desire | 0.92% |
| Nokia Lumia 900 | 0.80% |
| Samsung GT-I9000 Galaxy S | 0.72% |
| Google Nexus S Samsung Nexus S | 0.69% |
| Asus Eee Pad Transformer TF101 | 0.63% |
| Motorola DroidX | 0.59% |
| Google Nexus One HTC Nexus One | 0.57% |
| Samsung GT-P7510 Galaxy Tab 10.1 | 0.53% |
| Google Nexus 7 | 0.52% |
| Motorola XT862 Droid 3 | 0.50% |
| Verizon Droid2 | 0.45% |
| Nokia Lumia 800 | 0.41% |
| Motorola MOTXT912B Droid Razr 4G | 0.35% |
| Motorola Xoom | 0.33% |
| HTC ADR6400L Thunderbolt 4G | 0.30% |
| HTC ADR6300 Incredible | 0.30% |
| Motorola Droid X2 | 0.29% |
Browsers
Internet and Firefox both lost to Chrome, Chrome now has a 15 point lead against the number 2 browser. Here is the 1 year chart

Here is just the data for January and December so that you can see the difference between the beginning and the end of the year
| Browser | January | December |
|---|---|---|
| Chrome | 33.13% | 42.99% |
| IE | 30.86% | 26.85% |
| Firefox | 27.82% | 22.56% |
| Safari | 3.51% | 3.23% |
Operating Systems
In the operating system space, windows is still king, Windows phone is still a very niche player as well. Here is the one year chart for the operating systems
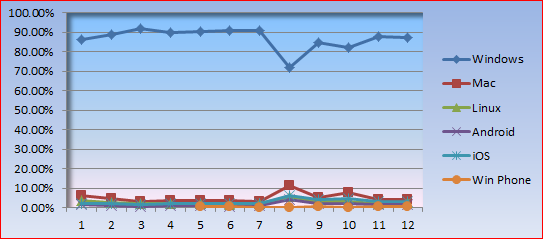
Here is just the data for January and December so that you can see the difference between the beginning and the end of the year
| OS | January | December |
|---|---|---|
| Windows | 86.24% | 87.35% |
| Mac | 6.13% | 4.30% |
| Linux | 3.42% | 2.39% |
| Android | 1.54% | 1.80% |
| iOS | 2.30% | 3.06% |
| Win Phone | 0.08% | 0.68% |
Mobile OS
Here is the data for mobile operating systems, I just picked the top 3 and only picked January and December so that you can see the difference between the beginning and the end of the year
| OS | January | December |
|---|---|---|
| Android | 38.78% | 32.17% |
| iOS | 56.19% | 55.080% |
| Win Phone | 2.06% | 12.04% |
Next year will be very interesting, we have to see what will happen in terms of new android and iOS devices. Will the Surface Pro help Microsoft win some tables market share or will the partners have to step up and come out with some cool Windows 8 tables? Time will tell……
 Denis has been working with SQL Server since version 6.5. Although he worked as an ASP/JSP/ColdFusion developer before the dot com bust, he has been working exclusively as a database developer/architect since 2002. In addition to English, Denis is also fluent in Croatian and Dutch, but he can curse in many other languages and dialects (just ask the SQL optimizer) He lives in Princeton, NJ with his wife and three kids.

