


Several weeks ago I posted a three part series on the ability to use available online logging services for instrumenting applications. None of the services overwhelmed me, but there was an additional service I found that caters specifically to numeric metrics. Given that I’ve had a tab sitting open on the Librato site for the past several weeks, I thought it was time to actually do the review.
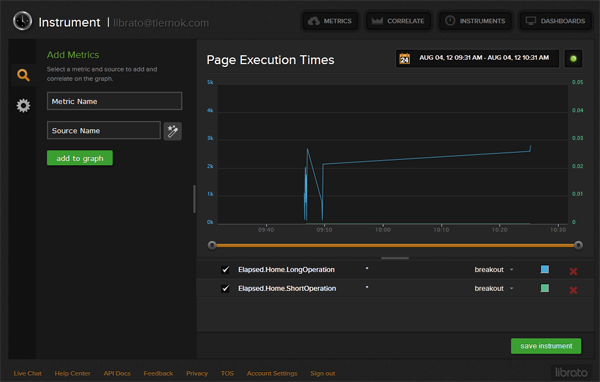
Sample screenshot from interface
Spoilers: I liked it. A lot.
About Librato Metrics
Unlike the unstructured data logging services in the prior posts, Metrics is all about storing, displaying, and alerting on numeric metric data. This limits how you would use it, for instance you wouldn’t be able to dig into a spike in page execution times and see the id’s of the users or the type of browser that was in use. On the other hand, the focus on numeric gauges and counters means that Librato can provide a deeper set of tools around graphing, alerting, and dashboards.
Highlights:
Librato’s API is extremely full-featured, offering GET/PUT/POST actions for creating, sending, and retrieving metrics, as well as endpoints to interact with other facets of the service, like dashboards. All of this is offered through an interface that is both polished and usable, with none of the lag I ran into on some of the other services. In addition, support for alerting is built into the application.
Input Support: HTTP GET/PUT/POST/DELETE everything (see note below) with JSON
Output Support: Same as above, plus has support for paginating large sets of results
Ease of Setup: Very easy through the interface or by just sending new data metrics, API token is immediately available for use
Searching: This is not a log service, so the searching only covers searching for entities (metrics, dashboards, etc)
Visualization: Great. Though they currently only have support for line graphs, the overall interface is fantastic and there are other graph types in the works
Note: The full list of elements you can interact with via the API includes Metrics, Instruments, Dashboards, Tags, Alerts, Services, and even Users.
General Opinion:
This service is easy to use, provides a really usable interface, and is completely open and extensible through a very rich API. Despite some hinkiness with the dashboard timespans, which I think is due to the small amount of sample data I had and their down-sampling method, this is an excellent service. The services also support sending data aggregated over a time period (multi-sample), so you can buffer and send at longer intervals if the finer detail is an unnecessary drain on your wallet or network.
I suspect that their interface uses the same API that they expose to end users, as I haven’t been able to find anything I could do in the interface that wasn’t also possible in the API. Exposing the data through the API also means that not only do we have all of the graphic and alerting capabilities that are built in to the service, we can also extend it to do more (something several of the other reviewed services required to even get a simple graph).
Getting the sample application hooked into the service was extremely easy, even taking into account the fact that I had to write a parallel set of methods to send the metric data instead of the log data for the other services.
Running the Sample Site with Metrics
Clone a copy of the sample application from tarwn/InstrumentationSampleCode on github. Go to the metrics.librato.com website and sign up for an account (they have a 30 day free trial).
After signing in to your account, you can access your account information from the “Account Settings” link at the bottom of the screen. Add or edit the sensitive.config file at the root of the .Net solution, substituting your values where appropriate:
sensitive.config
MetricProvider = Librato

Librato.URL = https://metrics-api.librato.com/v1/metrics
Librato.Email = your-email-here
Librato.Token = your-token-here
Load up the sample app, click some buttons, then switch over to Metrics to see the results. You should see several new gauges and counters in your Metrics list:
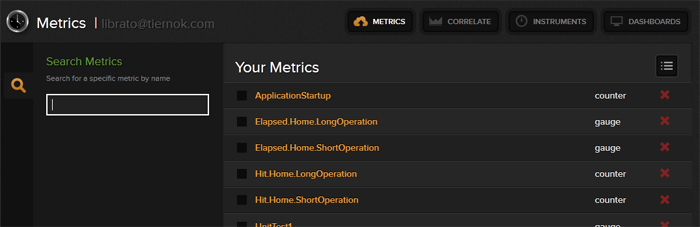
Metrics List
Clicking on one of these metrics will open the metric so you can see it’s display settings and a graph of it’s recent values:
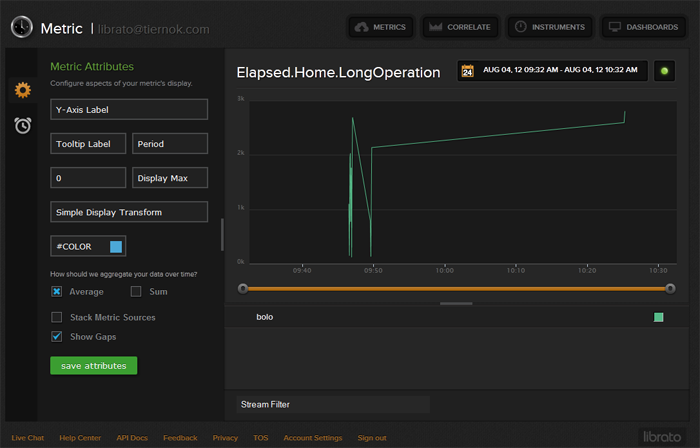
Metric Details
We could spend a lot more time getting into the details of creating instruments, dashboards, alerts and so on, but at this point you should have everything you need to start playing with those on your own.
I’ve really enjoyed using Metrics so far, and if you’re looking for a metrics tool you should definitely give it a test drive.
 My roles have included accidental DBA, lone developer, systems architect, team lead, VP of Engineering, and general troublemaker. On the technical front I work in web development, distributed systems, test automation, and devop-sy areas like delivery pipelines and integration of all the auditable things.


