Adding a Load Testing stage to my Continuous Delivery project has been on the todo list since I started the project. The addition will allow me to baseline the applications performance while adding some experience with load testing, a topic I haven’t been able to spend as much time on as I would like. Given I am doing this on my own systems and time, minimizing cost and complexity are also a priority.
While I have used a few load testing tools in the past, it’s primarily been for one off projects and widely spread over the last five to ten years. Load testing is not something we, as developers, are often called upon to do. In fact, load testing is generally considered to be costly, complex, and of limited value to any application that is smaller than [insert application 100x larger than the one you are proposing to test here].
In this post I’ll put together a basic load test to measure the actual performance of my application and serve as a baseline going forward. The next post will tie this into my continuous delivery pipeline so I can monitor changes in performance over time and detect problems before they make it into the wild. All in the space of a couple evenings.
Selecting a Tool
The load testing I do at this point will be integrated with a build server in the next post, so I know I need something that can run in a lightweight fashion and produce a log of it’s results. This led me to one of the free options I had tried in the past, Web Capacity Analysis Tool (WCAT) from Microsoft.
WCAT can be a little intimidating at first. It runs entirely command-line driven by settings files. The documentation goes quickly from a picture of one computer to a network with multiple switches, test clients, and so on. But behind that seemingly steep learning curve is the distilled, bare essence of a web load testing tool, with just the pieces we need to get the job done.
Installing WCAT
First up is installing WCAT and getting it ready to run on my system.
- x86 Download: http://www.iis.net/community/default.aspx?tabid=34&g=6&i=1466
- 64-bit Download: http://www.iis.net/community/default.aspx?tabid=34&g=6&i=1467
The download is an msi, so I can next, next, next my way to victory. This results in a Program Files folder that contains the tools, the documentation for the tool, sample files, and some C libraries for customization.
Next we need to set our default command-line scripting engine to cscript.exe so script output will go to the console, instead of show up in popups. In a console run:
cscript //H:cscript
_Note: this actually failed on my main system with an error indicating it wasn’t able to change my default script engine. I fixed this by opening up the registry and setting [HKEY_CLASSES_ROOTWSFFileShell] to “Open2”. The command above did work on my build VM, so YMMV_
WCAT is designed to run with one or more clients sending the requests to the target site. This architecture means we have a controller that orchestrates the test run and clients that actually execute it. In order to prepare systems for their future role as a WCAT client, we need to run the following (which will result in a reboot):
wcat.wsf –terminate –update –clients {server list}
This sets a couple registry keys on the client, among other things. More information is available in the documentation.
In my case, since I will be using the local system as both the controller and my solitary test client:
wcat.wsf –terminate –update –clients localhost
Create Settings and Scenario Files
WCAT requires a settings file and a scenario file. The settings file is primarily for the controller and includes the server that will be put under test, the number of clients that will be generating load, the number of virtual clients that will be used on each actual client, and performance counters to monitor. The scenario file is used mostly by the client and includes the details on what requests will be called, headers to use, etc.
In my case, creating the settings file was easy. I referred to my server by IP simply because my VMs are on a domain that doesn’t share DNS with the rest of my home machines and I didn’t bother adding any performance counters to watch.
settings.ubr
settings
{
	server		= "192.168.173.57";
	virtualclients	= 8;
	clients		= 1;
}
I used 8 virtual clients to match the number of cores on my desktop, but beyond knowing that that represents the number of threads that will be used, I’m not really sure how to size that value appropriately.
The scenario file is outlined in the documentation and a sample is included, but rather than hand-building it I found out that Fiddler can generate a WCAT scenario file from the HTTP session traffic it captures.
Sign me up.
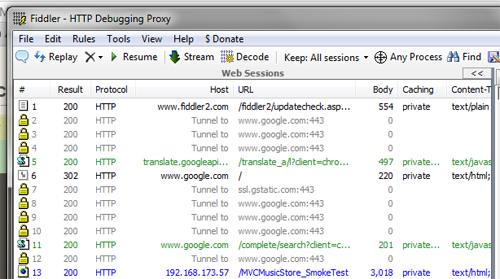
To get started I opened Fiddler, opened Chrome, then opened one of the sub-sites on my beta VM. This generated a bunch of traffic (especially with Firefox in the background throwing our requests to Delicious and Facebook).

Fiddler Screenshot
So I cleared the cache in Chrome and deleted all these entries (select them all, press delete). Clean slate.
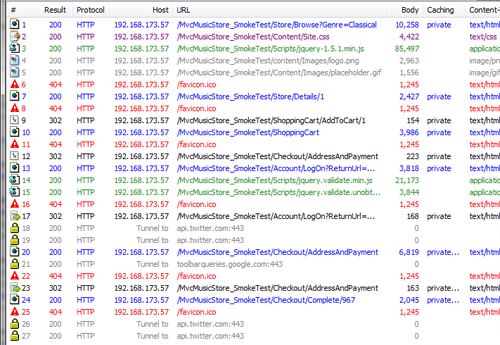
My load test is going to be a worst case. Every “end user” will visit with a cold cache and buy just a single item. This will give me a good combination of reads, writes, cart processing logic, and authentication. Generating the session information is as easy as following the path I want to test with Fiddler capturing the individual GET and POST requests in the background.

Fiddler Screenshot
After deleting all the irrelevant traffic, like the Tweetdeck calls to twitter, I have a list of GET/POST requests that ended in 200 and 302 statuses. Form the file menu I’ll select “Export Sessions”, “All Sessions”. The dialog offers several options for export, but the one I want is the WCAT option as the bottom.
The exported file is a WCAT scenario file I can run locally against my beta server. It still has the name of the randomly selected sub-folder I used in Chrome (my smoketest URL), but I’ll change that later after I have a chance to set up a new URL on my beta VM.
I would show you the file at this point, but it’s loooooooong. One downside to the export from fiddler is that each request has all of the headers defined separately. Later I’ll move the common ones to the default section of the transaction and clean it up some.
Running WCAT
With a settings file and a scenario file, I have everything I need to manually run WCAT. To simplify things, I’ve created a cmd file. This means I won’t have to type the command out each time and I can add it to a source code repository and re-use it later from Jenkins.
run.cmd
"C:Program Fileswcatwcat.wsf" -terminate -run -clients localhost -t FiddlerExport.wcat -f settings.ubr -singleip -x
FiddlerExport.wcat is my scenario file, settings.ubr is my settings file, the -singleip option tells WCAT only to use the first ip address that resolves for the server (not really necessary in this case), and the -x option tells it to collect additional information from the test server.
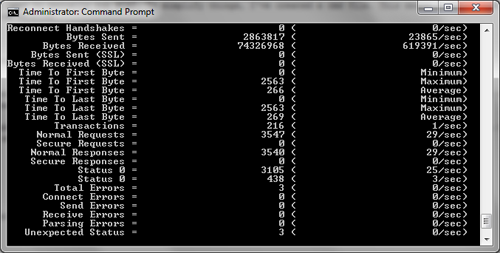
Running this command, the controller opens in one console window, then a second opens as my single client. The default options from the fiddler export are a 30 second warmup period, followed by a 120s test run, and then a 10s cooldown. In other words, just enough time to go top off the coffee cup.

WCAT Controller Screenshot
The controller stays open with the numbers from the last run and a log.xml file is produced with the results in the current directory. As you can see from the screenshot above, my little single-core, 1GB of RAM VM is managing to serve up ~30 requests/second and it’s erroring on just under 1% of the requests. The log file is more accurate, listing decimal places for values that are shown only as rounded ints on the console (that 1 transaction/second is actually 1.9, for instance).
Note: this run was from after cleaning up the log file below
Cleaning up the Scenario File
There are several issues with the initial scenario file that I need to clean up.
- It’s wordy, most headers are repeated for all the requests
- Several pages report as errors because they return status 302’s
- There is a session cookie hard-coded in from my original fiddler capture
Cookies: First I deleted all the cookie headers for session ID. WCAT manages cookies for individual virtual client, so this will allow it to manage the individual sessions instead of writing in one that probably doesn’t exist.
Repetitious Parts: Next I moved all the common headers to the default{} section at the top of the file. This was basically everything except the cookie header I removed above and the referrer header, which I left in the individual requests. My individual request sections have gone from 50 lines to about 8.
Status 302: WCAT considers a request to be in error if it receives an unexpected status. By default it expects 200, but for the couple posts that are doing redirects the last step is to add in the correct status code, like so:
FiddlerExport.wcat
...

    request
    {
      verb = POST;
      postdata = "UserName=DefaultUser&Password=AlsoDefaultUser&RememberMe=false";
      url     = "/MvcMusicStore_SmokeTest/Account/LogOn?ReturnUrl=%2fMvcMusicStore_SmokeTest%2fCheckout%2fAddressAndPayment";
      statuscode = 302;

      setheader
      {
        name="Referer";
        value="http://192.168.173.57/MvcMusicStore_SmokeTest/Account/LogOn?ReturnUrl=%2fMvcMusicStore_SmokeTest%2fCheckout%2fAddressAndPayment";
      }
    }

    ...
At this point I can run my cmd file again and everything runs successfully with about the same number of requests/second.
Using Load Testing Results
For the purpose of this post, I decided to load test an end-to-end sale and found that my poor little VM running against two Compact SQL files could handle 1.9 sales/second. Granted, I’m not actually doing payment processing, inventory awareness, shipping, and so on, but the important part is that I have a baseline. As quickly as I was able to put that together, I could see also testing a couple other scenarios specifically on key pages.
The measurements I gather from these scenarios serve three purposes:
Tripwire: Just like automated tests, a good selection of load test measurements running regularly can be used as a tripwire to let me know if a change I made degraded the performance of the site accidentally.
Performance Enhancement: With a baseline, if I decide that the application needs better performance, I have a guide that will tell me if my attempt to improve performance actually works as well as something to stress test the application while I’m using profiling or logging tools to find performance bottlenecks.
Now We Know: It’s not uncommon for us to guess or assume how well our application performs without actually testing it, I’ve even seen this in situations where capacity and response time was contractually guaranteed. Guessing at an applications performance works really well, right up until it doesn’t.
Were this an actual production application, I would try to test it under more consistent circumstances and, if I could, similar hardware (although there are ways to create reasonable production estimations based on scaled back load test environments). Even with the disparity in environments, a baseline is still useful to show me changes.
Next Steps
My next challenge is to incorporate this test run and its results into my build pipeline. This will allow me to capture the information automatically on a regular basis. In the next post I’ll pick up from here and cover executing the load test from Jenkins and capturing the results so we can see them change over time.
The Past posts in my Continuous Delivery series or resulting build pipeline are listed on the Continuous Delivery wiki page.


 My roles have included accidental DBA, lone developer, systems architect, team lead, VP of Engineering, and general troublemaker. On the technical front I work in web development, distributed systems, test automation, and devop-sy areas like delivery pipelines and integration of all the auditable things.


