While re-implementing my continuous delivery pipeline in TeamCity last week, I skipped over charting the load tests results from WCAT. This weekend I returned to this task to find that it was less tricky than it originally appeared.
How it works
TeamCity has project and build level custom charting that is driven by settings files. These files and the format of the necessary chart definition are documented. The actual graph XML is pretty straightforward and easy to implement. The files refer to values that are provided by TeamCity (listed on that page), via a special file you drop during your build (teamcity-info.xml), or via service messages.
Graph Definitions
In the Jenkins build I had graphed the following data from the WCAT run:
- Rate Graph – Transactions Per Second, Requests Per Second
- Totals Graph – Total Transaction count, Total Request count, Total Error count
- Response Time to Last Byte Graph – Minimum, Average, 95th Percentile, 99th Percentile, Maximum
To match this in TeamCity I created the project-wide graph settings like so:
<?xml version="1.0" encoding="UTF-8"?>
<settings>
  <custom-graphs>
   <graph title="Rate" hideFilters="showFailed" seriesTitle="some key" format="">
      <valueType key="TransactionsPerSecond" title="Transactions/s" buildTypeId="bt4"/>
      <valueType key="RequestsPerSecond" title="Requests/s" buildTypeId="bt4"/>
    </graph>
   <graph title="Totals" hideFilters="showFailed" seriesTitle="some key" format="">
      <valueType key="TotalTransactions" title="Total Transactions" buildTypeId="bt4"/>
      <valueType key="TotalRequests" title="Total Requests" buildTypeId="bt4"/>
      <valueType key="TotalErrors" title="Total Errors" buildTypeId="bt4"/>
    </graph>
   <graph title="Response Time (to Last Byte)" hideFilters="showFailed" seriesTitle="some key" format="duration">
      <valueType key="ResponseTimeAverage" title="Average" buildTypeId="bt4"/>
      <valueType key="ResponseTimeMinimum" title="Minimum" buildTypeId="bt4"/>
      <valueType key="ResponseTimeNinetyFivePercent" title="Ninety Fifth Percent" buildTypeId="bt4"/>
      <valueType key="ResponseTimeNinetyNinePercent" title="Ninety Nineth Percent" buildTypeId="bt4"/>
      <valueType key="ResponseTimeMaximum" title="Maximum" buildTypeId="bt4"/>
    </graph>
  </custom-graphs>
</settings>
Besides the key in each valueType tag, I also include a buildTypeid that is the internal build ID for my automated load test build. I found this in the address bar after clicking the build’s link on the dashboard:

Team City – Build URL
Defining the Data
Once I have the definitions roughly the way I want them, I need to make the data available from the WCAT run. WCAT already produces it’s results in XML and for Jenkins I created an XSL to transform the results into a new XML file that would be easier to plot in Jenkins. For TeamCity I’ll do the same, but this time I decided to use powershell to execute the transformation.
The WCAT results take some work to decode, as they are stored in XML that is halfway to presentation format. Luckily I have already done this once, so creating a new XSL is fairly easy:
<xsl:stylesheet xmlns:xsl="http://www.w3.org/1999/XSL/Transform" version="1.0">
<xsl:template match="/">
	<build>
		<statisticValue key="TransactionsPerSecond">
			<xsl:attribute name="value"><xsl:value-of select='//section[@name="summary"]/table[@name="summarydata"]/item/data[@name="tps"]' /></xsl:attribute>
		</statisticValue>
		<statisticValue key="RequestsPerSecond">
			<xsl:attribute name="value"><xsl:value-of select='//section[@name="summary"]/table[@name="summarydata"]/item/data[@name="rps"]' /></xsl:attribute>
		</statisticValue>
		<statisticValue key="TotalTransactions">
			<xsl:attribute name="value"><xsl:value-of select='//section[@name="details"]/table[@name="requeststats"]/item[1]/data[@name="transactions"]' /></xsl:attribute>
		</statisticValue>
		<statisticValue key="TotalRequests">
			<xsl:attribute name="value"><xsl:value-of select='//section[@name="details"]/table[@name="requeststats"]/item[1]/data[@name="requests"]' /></xsl:attribute>
		</statisticValue>
		<statisticValue key="TotalErrors">
			<xsl:attribute name="value"><xsl:value-of select='//section[@name="summary"]/table[@name="summarydata"]/item/data[@name="terrors"]' /></xsl:attribute>
		</statisticValue>
		<statisticValue key="ResponseTimeAverage">
			<xsl:attribute name="value"><xsl:value-of select='//section[@name="details"]/table[@name="histogram"]/item[2]/data[@name="response_time_avg"]' /></xsl:attribute>
		</statisticValue>
		<statisticValue key="ResponseTimeMinimum">
			<xsl:attribute name="value"><xsl:value-of select='//section[@name="details"]/table[@name="histogram"]/item[2]/data[@name="response_time_min"]' /></xsl:attribute>
		</statisticValue>
		<statisticValue key="ResponseTimeNinetyFivePercent">
			<xsl:attribute name="value"><xsl:value-of select='//section[@name="details"]/table[@name="histogram"]/item[2]/data[@name="response_time_95"]' /></xsl:attribute>
		</statisticValue>
		<statisticValue key="ResponseTimeNinetyNinePercent">
			<xsl:attribute name="value"><xsl:value-of select='//section[@name="details"]/table[@name="histogram"]/item[2]/data[@name="response_time_99"]' /></xsl:attribute>
		</statisticValue>
		<statisticValue key="ResponseTimeMaximum">
			<xsl:attribute name="value"><xsl:value-of select='//section[@name="details"]/table[@name="histogram"]/item[2]/data[@name="response_time_max"]' /></xsl:attribute>
		</statisticValue>
	</build>
</xsl:template>
</xsl:stylesheet>
(The final XSL is located on bitbucket in the event that I make any future changes).
The powershell command to run the transform is then as easy as:
$xsl = (New-Object System.Xml.Xsl.XslCompiledTransform)
$xsl.Load('%system.teamcity.build.workingDir%/TransformForTeamCity.xsl')
$xsl.Transform('%system.teamcity.build.workingDir%/log.xml','%system.teamcity.build.workingDir%/teamcity-info.xml')
TeamCity replaces the variables with the correct values and transforms the generated log into the specially named “teamcity-info.xml” file.
Done
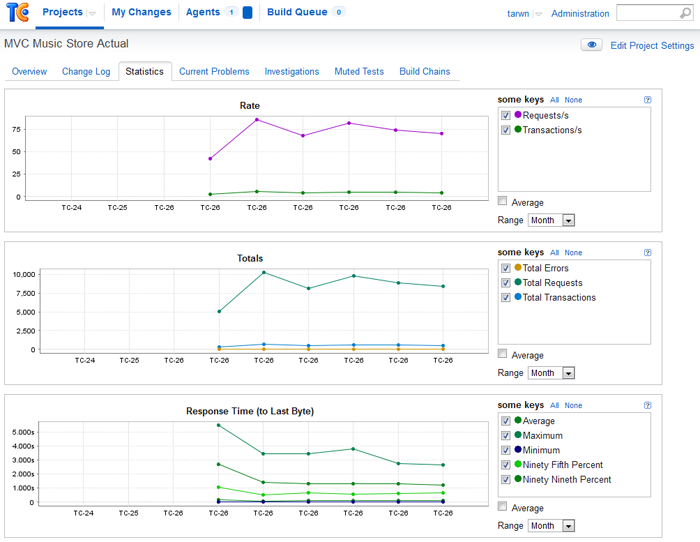
I wasn’t happy about editing settings file in TeamCity directly, especially given the implications this has in a real environment (how many people would need to be involved to do this in a heavily audited environment?). However that was the only issue I had and I am happy with the results (the build versions are the same because I rebuilt several times so I would have a decent chart):
For bonus points, the same functionality you have with the built-in charts is available here. You can change the time period, view averages of the values, and change which points are graphed by checking or unchecking them.


 My roles have included accidental DBA, lone developer, systems architect, team lead, VP of Engineering, and general troublemaker. On the technical front I work in web development, distributed systems, test automation, and devop-sy areas like delivery pipelines and integration of all the auditable things.


