


 It’s my T-SQL Tuesday! I’ve spent the last year learning and teaching Extended Events – because if you really want to learn something, teach. XE can be used for everything from very simple tasks, such as counting the number of query executions, to very complicated tasks, such as anything Jonathan Kehayias writes about! I’m encouraging other bloggers to write about XE today in hopes that I’ll learn some new stuff – and if people have questions, that we’ll be able to teach them.
It’s great, but it’s not complete
XE is supposed to be the replacement for Profiler. But, Profiler had two great features that XE doesn’t. I’ve found a workaround for one, but not the other – maybe someone will be able to solve that mystery for me.
Stopping a session
When I created a Profiler trace, I could “Enable trace stop time”, and the trace would end at that particular time. I used this for many reasons – when I started a trace and knew I’d get caught up in something else, and didn’t want it to run until I (hopefully) remembered to stop it; when the server would always get slow between, say, 10:00 am and 11:00 am, but no one knew why; or when looking for things that happened in the middle of my night – I didn’t want to get up at 2:00 am for Profiler.
XE doesn’t have this capability. It’s not in the New Session Wizard, it’s not in the New Session un-wizard, and it’s not in the T-SQL. However, this is easy to work around. After creating a session, create a SQL Server Agent Job that stops the session, then schedule it.
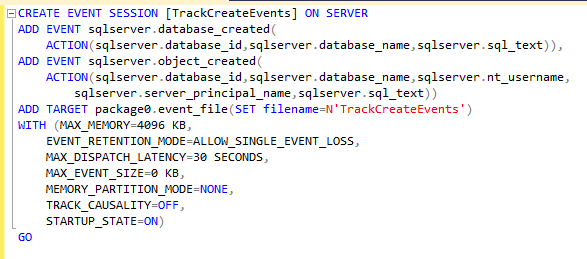
Here’s my session – I’m tracking database and object creation.
I create a Job that has one step – this is to set the STATE = STOP.

Then, I schedule the job to run once.

I check Event Viewer and confirm the job ran. In SSMS, I can see the session is stopped.
This works, but it isn’t as easy or convenient as having the option right in the session creation.
Correlating a Session with Perfmon
Once upon a time, I learned that if I set up a Perfmon collection and a Profiler trace, then stopped them both, I could view the results at the same time in Profiler, thus allowing me to see if CPU usage spiked or page life expectancy dropped, what executed at that time. I solved a lot of problems with this over the years.
Much to my dismay, there is no tool like this for Extended Events. I’ve wished so hard for this, I thought about writing it myself – but my programming skills are so rusty, I’d probably be working on it until XE is deprecated. Perhaps someone will read this and be inspired? I can hope!
But I Still Love Extended Events
Despite these two flaws, I love Extended Events. The ease of setup, the breadth of events to track, the advanced filtering, the minor impact on performance – all of these add up to a better tool. I can’t wait to hear what you have to write about for T-SQL Tuesday!
 Jes Borland is a Premier Field Engineer - SQL Server for Microsoft, where she is a trusted technical adviser, deep technical support, and teacher for her customers. Her experience as a DBA, consultant, and 5-time Data Platform MVP allow her to help the business and the IT teams reach their goals. She has worked with SQL Server as a developer, report writer, DBA, and consultant. Her favorite topics are administration, automation, and performance. She frequently presents at user groups, SQL Saturdays, and other community events. She is also an avid runner and chef.
