


Default Trace
With SQL Server 2005, 2008 and on, there are many ways for us to now track events like SHRINKFILE. Some of these are Event Notifications, XEvents and the well-known but often-forgotten, Default Trace. The Default Trace has been in SQL Server since 2005 and by default is set to enabled. The Default Trace essentially captures and logs most configurations and schema changes that occur on SQL Server.
Since the default trace is enabled by default, the chances of this logging mechanism being on in your environment are good. At the time you find a configuration or major change to the database servers you are in charge of, you can turn to the trace files to analyze when and who may have done the changes.
Take the following scenario:
Company’s database team consists of six DBAs and each of these DBAs is in charge of specific SQL Server instances. Although each is assigned a specific group of the total number of instances, when the need arises, they will take care of each other’s instances. One of the DBAs noticed that a transaction log file on one of their database servers has been truncated and a shrink file run on it. The question came up, “My log file was truncated, shrunk and blown to the wind. Who did it?”

Without having any other active logging mechanisms in place, the default trace can be looked at to determine by whom and when the shrink file was executed.
To search the default trace, first determine if the default trace is enabled. In SQL Server 2005 this can be done by running sp_configure as follows:
EXEC master.dbo.sp_configure 'show advanced options', 1;
GO
EXEC master.dbo.sp_configure 'default trace enabled';
GO
SQL Server 2008 uses Policy Management for enabling the default trace and can be found by going into Policy Management and Facets in SSMS. Under Server Configuration, the parameter DefaultTraceEnabled will be set (as shown below).
Once the default trace is validated and running, determine the location the trace files are being written to by running the function, fn_trace_getinfo
SELECT *
FROM fn_trace_getinfo(default);
GO
This will result in the properties that are set for the default trace. Property two will show the file location that we can read for the events that were logged.
To read the trace file, use fn_trace_gettable. This will pull all the data from the trace file and show it in a table format in SSMS for ease of reviewing
SELECT
	TextData,
	HostName,
	ApplicationName,
	LoginName,
	StartTime
FROM
[fn_trace_gettable]('C:Program FilesMicrosoft SQL ServerMSSQL10.MSSQLSERVERMSSQLLoglog_47.trc', DEFAULT)
WHERE TextData LIKE '%SHRINKFILE%';
The query above has the condition filtering on TextData to search for any event that has the string, “SHIRNKFILE”. This will filter out any events but the SHRINKFILE event that we are most interested in finding. Executing this statement on a default trace file that has one SHRINKFILE event results in the following display.
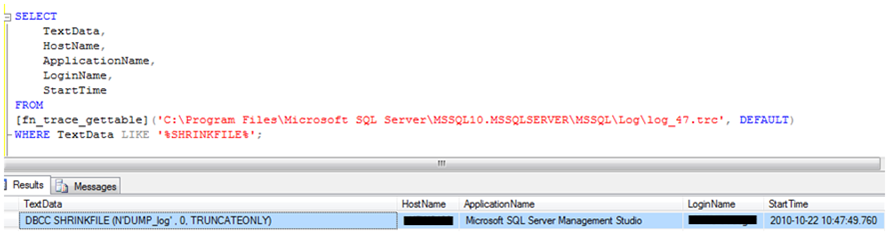
We can see now that the user listed executed the statement, DBCC SHRINKFILE on 2010-10-22.
Closing
The default trace is a valuable source of information for determining changes to SQL Server. The performance load to leaving the default trace is light and it is recommended to leave it on or implement another auditing method so these major risk changes are not gone without fully analyzing the reason and requests behind them.


