**
Monitoring SQL Server
Monitoring SQL Server, or for that matter, any database server, is a critical aspect to a DBA or team that is hosting data services. In order to maintain a successful percentage of uptime, we as DBAs must rely on tools like this to manage alerts, performance baselines and the historic collection of statistics. All of these points can be accomplished without a boxed tool but the efforts that go into customizing them on our own outweigh the cost of the products themselves. A DBAs time is money spent with little return. This is a hardened fact that we have to accept. We do not provide a product to sell or a return in revenue. What we return in value is a constant flow of data to the business continuity. When we spend our time working more efficiently and budgeting our resources better, we as DBAs are more successful and obtain the value we look to achieve.
In this post I will show how Red Gate and the new SQL Monitor can help us achieve that goal. As a personal note, I have been as impressed with SQL Monitor as I was with the older SQL Response tool. The effect a monitoring tool leaves on my SQL Server instances is just as important as the value it adds to them. Red Gate has done a very good job at making that equation come to a winning result.
**
Installing SQL Monitor
Installing some products can be a painful process. This pain can be from confusion and requirements for hardware or added licensing for other products to support it. In reality, the most successful process of installing a product is when clicking Next, Next, Finish results in a working product after the click of the finish button. SQL Monitor. Let’s go over some aspects that were noticed during the process.
**
Installation high points
- You can install the base monitor and web server on separate physical servers
- Big one: you can use IIS or use an XPS web server that is packaged with the installer
- Customized port settings if you have ports that are taken on the web server or database server you use for SQL Monitor.
- This installation used SQL Express as the repository database for SQL Monitor. This availability means that an added license for SQL Server is not required if you stay under the limitation of SQL Express.
- Setup is, as with most Red Gate products, easy and clear.
To login you will need to create a password. The needs for the password were a little unclear but later it is clear upon logging out of the monitor and back in. When logging in, all you need is a password. That was a little surprising since I picked windows authentication for everything during the setup. Not 100% sure I like the fact that there isn’t a user account so then multiple users could be controlled for accessing the monitor.
On startup, adding servers is pretty clear as far as how to do it. There is a convenient dialog shown so you do not have to hunt and peck for adding your servers to the monitor at first.
A note on adding servers that I think could be added to the process: the monitor does not seem to check for the actual existence of the instance before adding it to the monitored servers listing. I would like to see an option to install the instance if it is not readily pinged. The primary reason for this would be typos and misspelling the instance name. If you make the mistake, you will need to go through removing the instance to fix it.
For example: I added an instance to the Monitor that was named, foo. This instance does not exist but it went through registering it and entering it into the Monitor’s database for me to later clean up.
By default the monitor looks for a default instance as well. That was a nice feature. Makes sure you monitor the instance you installed the DB on (as it appears). Only thing was, I didn’t have a default instance so it showed a big red x when one wasn’t needed.
One instance (a SQL Express instance) failed to register. Error: Bad Data.
Looking at the comprehensive list of events when it was registering showed, “Perfmon data is missing objects: MSSQL$SQLEXPRESS:Access Method. Possible causes include performance counter library corruption, or a 32-bit/64-bit mismatch between Windows and the performance counter provider (e.g. SQL Server).”
The machine that SQL Monitor was tested on also had SQL Express x86 and SQL Express x64 installed. I can only come to the conclusion that this is the direct problem after exhausting my efforts to bring the instance up in Monitor successfully. The concept of mixing the two platform specific SQL Server installations is very rare so I do not feel this is a bad point for the Monitor. As I would expect, the instance that survived the registration in Monitor was the 64 bit version that matches the Windows platform. I will later test this on a full installation of SQL Server x86 on a x64 windows installation as that is a common of a setup. Even with this failure to register the SQL Express instance completely, it appeared that the instance was being monitored to some extent. Databases were shown and alerts generated for backups missing and other useful alerts.
I will let the team know of my findings in hope it will be helpful in possibly making this available.
**
First thing I want setup
There are a few things that I as a DBA want setup before doing anything else. One of those is email alerts. Let’s be honest, there is only so much time in a day and opening a tool and looking at everything is not as easy as it sounds. Email alerting is a must when it comes to our instances. When SQL Monitor was finished installing and I logged in, there was a nice view of four tabs that I had available. One of those tabs was, “configuration”. A thorn in any product is when configuring it is painful or so complex that you simply do not set it up just how you want it. Sometimes that even goes as far as getting to configuration settings. SQL Monitor makes this entire process easy and clear.
**
Setting up email alerts
To setup the email alerts, go into the configuration page and click, “Email settings”. Enter all your information for where to send emails, the sender (which I made, SQLMonitor@mydomain.com) and then mail server settings.
Next, make sure you setup your alerts and what you want to be alerted on. Trust me, your inbox will be filled with alerts that you just don’t want in there. When I say filled, I mean filled. It is good that SQL Monitor has a default listing of what to email out. I like this very much for a more junior level position where the question may be raised on what really is important.
**
Let’s take a tour
The first things we all do when installing a new product is take a tour. At first glance the home page shows a very nice representation of how the monitored SQL Server instances are performing.
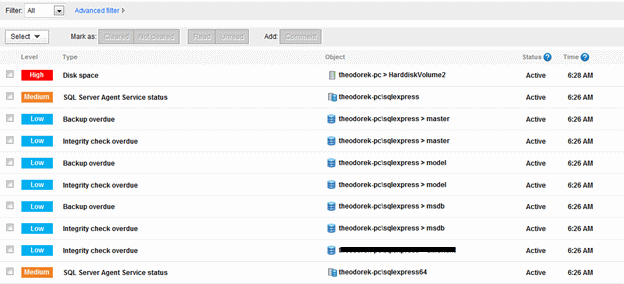
As you can see, my instances aren’t doing very well.
The first thing we notice is the SQL Server Agent Service Status alerts. This is alerting me on the agent status for SQL Express. SQL Express is a sore spot again here. The agent service is, if you will, an unusable service installed with SQL Express. This is probably the reasoning for the alert showing as this service does not function as other more comprehensive editions.
Each page view that you are brought to by clicking all of the instances has been setup to perform one task: show you what you need to know and what matters. This goes to SQL Monitor really taking into account what we as DBAs want and need to see for a monitoring system and troubleshooting tool.
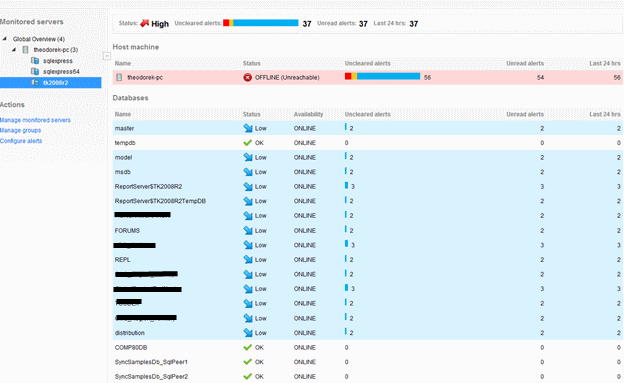
From the below snapshot we can see that primary status of the instance is shown, the level of alerts on the instance, alerts we have been ignoring, database status and the level of alerting that the instance has raised.
The level of the alert status is critical. A DBAs day is busy and having to dig into all instances with any alert is a handicap. When time is slim for proactively checking all of your SQL Server instances, having a “High” alerting process with the easy to point out view of that status is extremely helpful. As you can see from my High alert status on the instance below, that is provided right away in SQL Monitor.
**
Disk Space
Disk space is probably one the high points in my work helping others with system problems. SQL Server installations not configured correctly often cause disk space to run low. Log file growth, backup plans etc… all can cause disk space to run low very quickly.
The alert above is indicating I have an extreme issue with disk space that needs to be looked at quickly. Clicking the alert shows a very good representation of where my disk is going along with the statistics of what is used and what is available. To go further in-depth of the disk utilization; SQL Monitor shows information that is invaluable for analyzing disk usage. The performance data section that is shown starts with the host machine and shows counters:
- Machine: processor time (%)
- Avg. disk queue length
- Avg. CPU queue length
- Machine: memory used (%)
- Disk transfers/sec
- Memory pages/sec
These main performance counters are all counters that DBAs focus on for a high-level representation of how disk is performing. You can tell from this that the SQL Monitor team at Red Gate put experienced DBA feedback to use in what to show first for navigating disk performance.
Navigating through the other performance tabs shows more required counters for monitoring SQL Server, System processes and SQL processes/Profiler traces from a high vantage point.
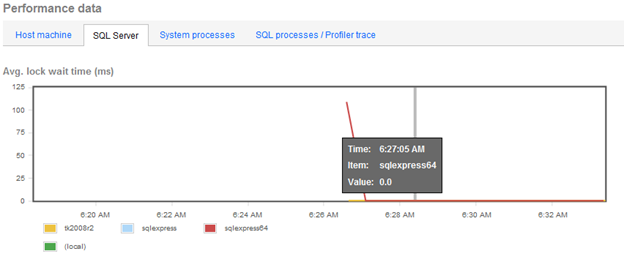
The graphs made available for a quick view of how things are running are also very well done. As a DBA with experience using many monitoring tools and understanding that the important part to alerts and fixing problems; the concept of animations or big and shiny pictures is not something I myself am concerned with. What I want as a DBA is a quick and thin representation of where a problem is. SQL Monitor provides just that in a thin and meaningful graph of the state of the counters you are viewing. The last thing a DBA wants to wait for while looking for a problem is a period of time they need to wait while graphs are loaded. Added to the graphs are quick tooltips of the timeframes in which a value of that timeframe can be viewed without digging into the graphs details.
**
Making alert tasks
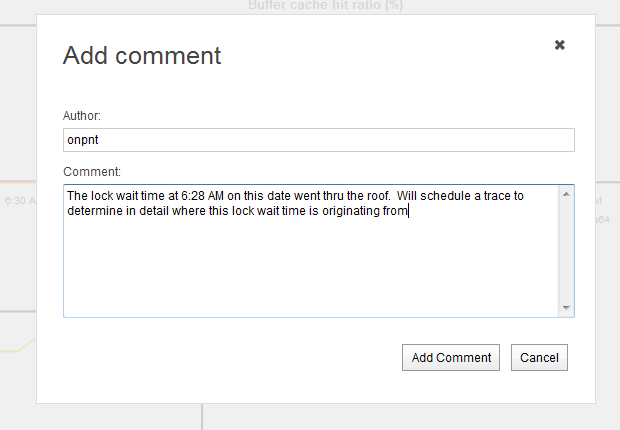
A monitoring system for SQL Server is enhanced by becoming a task repository. Let’s face the fact that through the day DBAs can and often have a large amount of tasks, alert and solutions that are handed to us. Reviewing alerts and acting on them right then and there is just not feasible at times. SQL Monitor has a great function in which you can comment on all the views to manage tasks for scheduling traces, assigning to others or adding comments to mention why a spike or alert occurred.
For example: in a performance data view of SQL Server on my monitor, an alert was raised around 6:28AM for high wait times. I could have dug into management objects and historic data of the processes and transactions that were hitting my database server at that time but alas, I was required to get a project out at the same time. Since the wait time was a spike and released, I can add a comment that a trace will be scheduled to capture all the information I need to resolve the high waits or check it off as a onetime issue.
This is one of the most useful functions I believe in monitoring systems since my memory is not that great and as many know, I am horrible at writing things down.
**
View a database
Let’s think of a high-level database view in a few ways
- Information to better help us quickly troubleshoot issues
- Documentation
- Quickly determine configuration changes that are needed
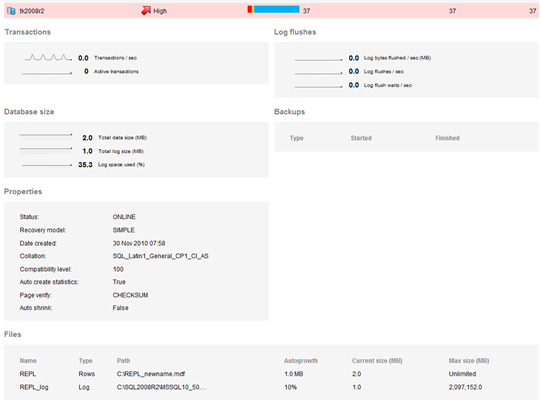
The first point is covered extremely well with Monitor. Looking at this information from the perspective of both a DBA and a person that helps often on forums and other technical resources, the information here is invaluable to me as the person helping. Take log growth for example. Log growth is a question that is asked very often and why logs may be growing out of control. The information I would require to help someone in determining the reasons at a high-level are right in front of you with the database view in Monitor.
- Recovery model
- Max size
- Current size
- Autogrowth
- Auto shrink
- Active transactions
All of this information is a must to make a first round suggestion on why a log file may be growing rapidly. Something that would help this view greatly would be a last backup column in the File area. This comes out of the question, “Why is my log growing out of control”. Failure to back up your logs in Full recovery model is typically the reason for that.
**
The SQL Server error log
The last thing I want to cover on SQL Monitor in this opener to a series on the product is the SQL Server error log section. SQL Monitor has in the default page view of each instance that is being monitored a section near the bottom for the error log entries. The helpful thing about this section is the fact that the entries are parsed out to only show the values that are pertinent to the instance you are viewing. I know that I have spent a lot of time writing either custom scripts, SSIS packages and Posh scripts to provide this information to me in a readily available format. Either that or you load the extremely slow snap-in from SSMS to search the logs.
The SQL Server error logs have a great deal of useful information in them when it comes to a quick view to find problems or while analyzing problems. SQL Monitor adding this to the opening page of each instance is a great idea.
**
Part 1 comes to a close
As I mentioned in the opening of this post, there are going to be a series of posts to come on SQL Monitor. This was the opening to the new product from Red Gate and my initial thoughts on some high points of the setup process and first glance. The next post that will follow will dig into the values that are collected be SQL Monitor and the value as a monitoring system they provide. The last will go over the internals of SQL Monitor. Internals will go over how SQL Monitor is collecting the information it is showing us and how it affects the database server we host the database it uses to retain all of these collections.
My first glance rating of SQL Monitor (1 to 5) is a solid 4. That is extremely high for me as I am hard on tools like this and the footprint they leave on my systems. As such, this monitoring tool as replaced my others and taken the spotlight as my primary tool to use. Cost + functionality + value make this a winner. The post on the footprint SQL Monitor leaves is the winning factor so look for it soon.


