


Analyzing deadlocks in SQL Server can be a frustrating and painful task. As frustrating as they are, often as a DBA, you’ll also have to explain what, why and how a deadlock(s) were causing performance or loss of transactions. With Plan Explorer Pro now having a deadlock graph analyzer, this task has been simplified a bit. Plan Explorer Pro has also given the DBA a way to portray deadlocks to other business or technical teams.
What is a deadlock?
There are many definitions of deadlocks, and a vast amount of articles written about them on the internet. One thing is certain: deadlocks are a performance and data integrity issue that can cause much pain and loss of business time. A clear definition to use for a deadlock is: deadlocks are an event when two queries have a lock on resources both require in order to complete their transaction. For example, imagine a transaction comes in from an application and locks an order table where the order number is 1, so it can update the order. Another transaction comes in and locks an order detail table where the primary key relates back to the order table of an order number 1, so it can update order details. The first transaction updates the order table but triggers an event to update the order details table due to a trigger on the order table. While this is happening, the second transaction updates the order detail table and also triggers an event to update the order table due to another trigger on the order detail table. At this point, the first transaction holds an exclusive lock on the order table and the second transaction holds an exclusive lock on the order detail table. Each transaction has caused a triggered event. The first transaction must update the order detail table to complete; the second transaction must update the order table to complete. Neither transaction can complete since there are exclusive locks held on the tables that they both need to finish.
The example above is a classic design flaw and cause for deadlocks in a database. Applications can effectively cause the same event by design if they open transactions, place a lock on a row and don’t release that lock correctly or quick enough. Another instance of the same application could come in and lock another row but come around to require the row that is already locked in order to complete. That example is typically due to leaving transactions open and not committing them – the easiest way to mimic a deadlock.
Cause a deadlock and capture it with Profiler
Let’s go over a simplistic example of a deadlock and show how Plan Explorer Pro can help determining the root cause and next steps in the resolution of a deadlock.
The following example will utilize the database QTuner_Design from previous articles on LessThandot.com.
To create a deadlock so we can obtain the deadlock graph, use a combination of three sessions, holding locks on the rows and SQL Profiler.
To setup profile to capture the deadlock graph, start Profiler and alter the events to capture Deadlock graph and Lock: Deadlock (Lock: Deadlock is an identifier to easily find the deadlock graphs in profiler when many events are being logged).

Start Profiler and leave it running in the background.
Kids: don’t try this at home. And by home, I mean a production server.
Open SSMS and open three query windows. In this example, the three query windows are holding session IDs 58, 59 and 60. In each query window, paste the following T-SQL code.
USE QTuner_Design
GO
BEGIN TRAN
SELECT
	*
FROM [dbo].[OrderHDR_Poor]
WITH (TABLOCK, HOLDLOCK)
WHERE ordernum = 4688235

UPDATE [dbo].[OrderHDR_Poor]
SET customerName = 'Deadlock'
WHERE ordernum = 4688235
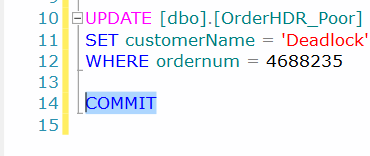
Go back to session 60 (first query window opened) and execute the statement. Then execute the statement in 59 and 58 in sequential order. At this point, 60 is blocking the other statements from completing and would remain so if the sessions were left as is. To force a deadlock, all that is needed is to COMMIT session 60. To do this, go to session 60’s query window and type “COMMIT”, highlight COMMIT and execute the statement.
When the COMMIT is executed, session 59 will throw a deadlock error as shown below.
(1 row(s) affected)
Msg 1205, Level 13, State 56, Line 8
Transaction (Process ID 59) was deadlocked on lock resources with another process and has been chosen as the deadlock victim. Rerun the transaction.
Session 58 should now complete. Session 58 is the beginning to another potential deadlock given the transaction being left open and the locks held. The reason session 59 deadlocked is due to both waiting on the same resource to complete. While both waited, as soon as session 60 did commit, one of session – 59 or 58 – can succeed and one fail in order for everything to continue. This example is setup this way to portray a typical design flaw in coding a process. If an application is set up to run the same statement and hold a lock on data, and three users perform the same action, the first session may commit after a time period allowing other sessions to start. Once the first transaction is completed, the second and third are still fighting over the same resource. To allow the third to continue, the second is found to be the victim of the deadlock so the third session can proceed.
If this mechanism was not in SQL Server, you can imagine how a server could lock and block forever or portray data incorrectly when queried.
Go back to Profiler and see if the deadlock was captured. You should see a Lock: Deadlock and Deadlock graph row appear in profiler.
Highlighting the row in profiler will show a generic graph in the preview pane

To look at this in more detail and a bit clearer, save the graph so we can open it with Plan Explorer Pro. To do this, right click the Deadlock graph row in profiler and select Extract event data...When prompted, save the graph as an XDL file named deadlockgraph.xdl.
Open Plan Explorer Pro and browse to open the deadlockgraph.xdl file.
Review in Plan Explorer Pro
The first thing we can see in Plan Explorer Pro is an easy to read and easy to analyze display of the graph. Plan Explorer Pro will show the session that was the victim in the deadlock at the top of the screen. Below the victim session, you will be able to expand through the details of the deadlock to show the owners and waiters in the deadlock. Expand the first row and then expand the object lock to get into the owners and waiters row. This will show us information based on the wait time that was taken in the deadlock, the database ID, session ID and a few other important pieces of information.
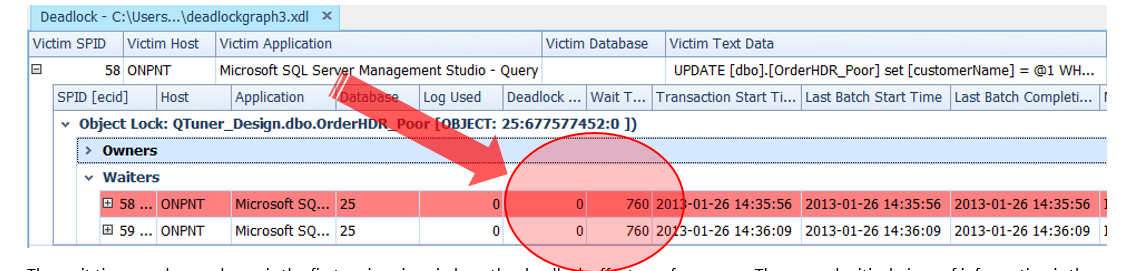
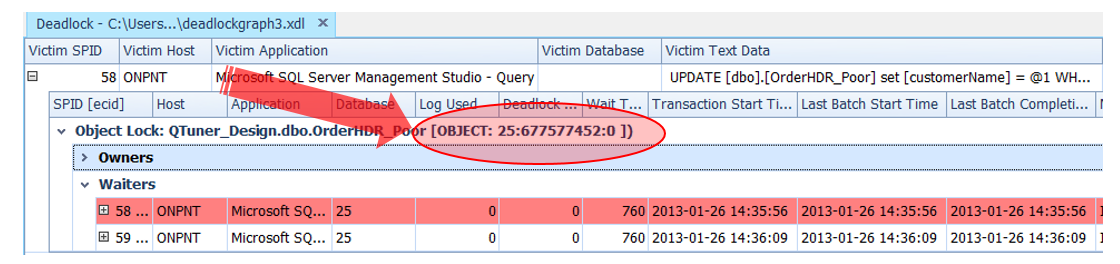
The wait time, as shown above, is the first major piece in how the deadlock affects performance. The second critical piece of information is the actual object that the deadlock occurred on. In our example, QTuner_Design.dbo.OrderHDR_Poor, is the object the deadlock occurred on.
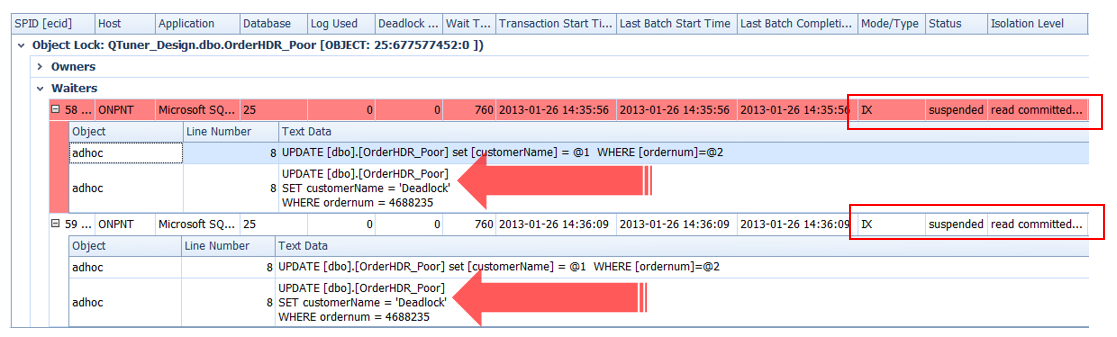
Having the wait time and the object are critical pieces to analyzing the deadlock as well as relaying the problem to others. Going further, expand the waiters rows. This will drill further into the statements that the deadlock occurred on and the type of locks that were involved. In our example, the intent exclusive lock (IX) was taken and the statement executed in the two sessions. Identifying the statement in many cases is the best path to a resolution in a deadlock situation. In this case, the IX and read committed isolation level could mean a transaction is being left open in an application or process. This means other transactions that come along and try to perform the same query will have the same results; blocking until the initial completion causes the deadlock between the second two. Having the statement and the isolation level could lead us right to the call in the application.
Another nice feature is the lock Mode/Type and wait time on each session. This can truly tell a lot in what was happening at the time the deadlock occurred.

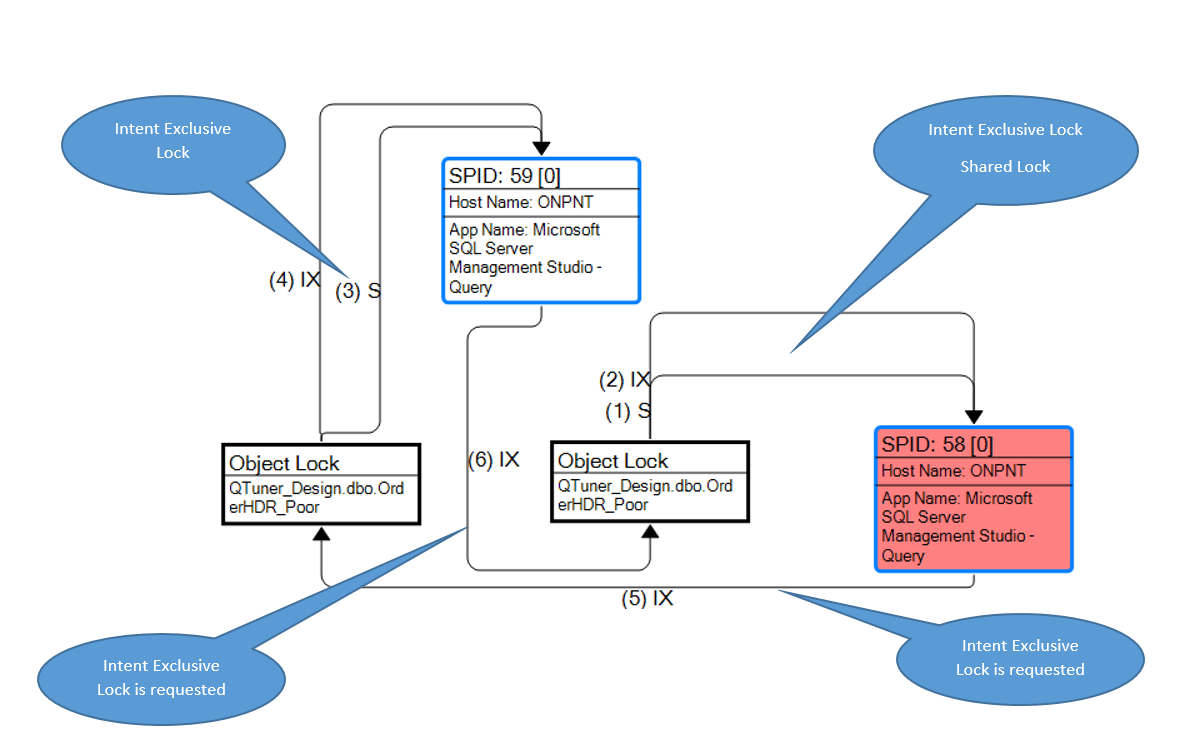
Something added in Plan Explorer Pro is a better formed diagram of the deadlock graph. In profiler we had a graph, but it could be confusing. Plan Explorer Pro formats the graph to be a bit easier on the eyes by showing the path of the locks as they represent the exact reasons and locks that have caused the deadlock.
In our example, the graph shows the direction of the events as they occurred. SPID 59 and SPID 58 both requested a shared and intent exclusive lock on OrderHDR_Poor. At the same time, both SPIDs then went on to request an intent exclusive lock that was in the form of the update to the same object and row. Since the lock could not be taken by both, one had to be a victim in order for the other to proceed.
Summary
Looking at Plan Explorer Pro and the ability to show and analyze deadlock is a great addition to an already, great tool. The fact that a DBA can now take this information in the form of an easier to understand diagram, to management or others that may not understand an already hard to explain topic, is worth much alone.


