


Do you need an SSRS 2005 report that displays totals for the previous 3 months going horizontally across ? Well, I did, and my first approach involved using derived tables, each with a separate date range, to get each month’s total to appear in its own column. While I achieved my goal, performance was lousy because the query needed to execute 3 times (once for each date range).
I shaved 2 minutes off the query execution time with a second approach. This alternate approach involves using a single query for the entire, 3-month date range, along with a GROUP BY clause including year and month. For the SSRS piece, I use a matrix format to get the months to display horizontally across. Since I have additional columns to display besides the total, I have to do some extra maneuvering, but more on that, later.
Here’s a look at the T-SQL code:
USE [AdventureWorks]
GO
IF OBJECT_ID ( 'dbo.usp_AdventureWorks_matrix', 'P' ) IS NOT NULL
    DROP PROCEDURE dbo.usp_AdventureWorks_matrix;
GO
create Procedure dbo.usp_AdventureWorks_matrix

As

set nocount on;

begin

declare @today datetime
set @today='2004-07-01 00:00:00.000'


Select year(hdr.[OrderDate]) as year
,month(hdr.[OrderDate]) as month
,hdr.[TerritoryID]
,p.ProductNumber
,p.Name
,sum(det.OrderQty) as qty
,p.SafetyStockLevel
,p.ReorderPoint

from [AdventureWorks].[Sales].[SalesOrderHeader] hdr
join [AdventureWorks].[Sales].[SalesOrderDetail] det
on hdr.SalesOrderID=det.SalesOrderID
	join [AdventureWorks].[Production].[Product] p
	on det.ProductID=p.ProductID

where convert(datetime,convert(varchar(10),hdr.[OrderDate],121))>=CONVERT(datetime, CONVERT(varchar(10), dateadd(mm,-3,dateadd(Day,Day(@today)*-1,@today+1)), 120), 120)
and convert(datetime,convert(varchar(10),hdr.[OrderDate],121))<=CONVERT(datetime, CONVERT(varchar(10), dateadd(mm,0,@today - day(@today)), 120), 120)

group by hdr.[TerritoryID]
,p.ProductNumber
,p.Name
,year(hdr.[OrderDate])
,month(hdr.[OrderDate])
,p.SafetyStockLevel
,p.ReorderPoint

end
With the stored procedure written, I’ll go to SSRS 2005 and add a Matrix Report Item. I then drag the year field to the matrix cell that displays columns, the TerritoryID field (leftmost column on desired report) to the matrix cell that displays rows and the qty field to the matrix data cell (where the columns and rows intersect).
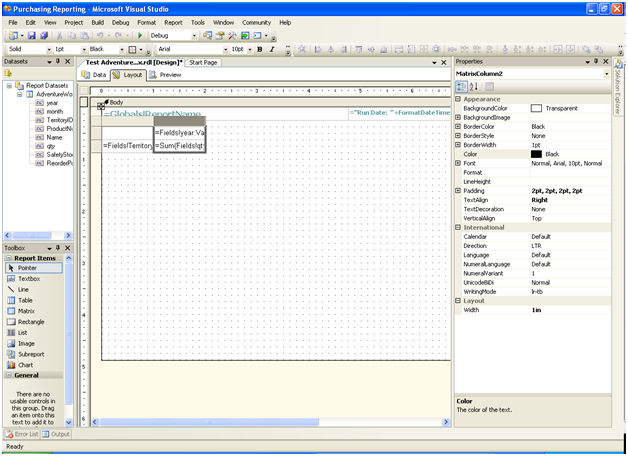
However, this is not a simple matrix scenario as I have several additional columns I need to display, besides the totals by month. In order to accomplish this, I’ll add row groups for each additional column.
But first, I’ll start with the column groups. I right-click above the year column group and choose ‘Add Column Group’ to add the month…
…and sort on the month field:
That takes care of my column groups.
I proceed in the same fashion for my row groups. I right-click on the first row group and choose ‘Add Row Group’:
I group (and sort) on the next field I want to appear on the report, the ProductNumber:
I repeat this until I have all the columns I need.
As an additional step, for each column and row group I want to sort on, I make sure I’m sorting on the same field I’m grouping on. To check this, I right-click on the group and choose ‘Edit Group’:
Now, the headings for the row group columns are missing because the Matrix Report Item has only an empty box in the upper, lefthand corner by default. To avoid ambiguity in the report, I add a Rectangle Report Item (to the upper, lefthand corner) then textboxes, one for each column needed:
I then type in the row group column headings:
I also apply some formatting to improve the appearance of the report, including editing the expression for month so that the month name appears:
And voilà ! Below you see the finished report that is speedy and even has column headings for the extra row group columns !
 Rose has been working with SQL Server since version 7. She lives with her husband Tony and corgi, Samantha, in the Chicago area.

