


As database professionals, our intent is to be as proactive as possible when it comes to delivering data with security, stability and speed in mind. Being proactive means active monitoring, reporting performance variations and most important, baseline capture. Adding to these three objectives, we can add Performance Notes to also provide key points of long term and short term performance problems.
Let’s take a minute to discuss the three key points (Baselines, Active Monitoring and Reporting Performance)

Baselines
Every system is unique. We can say that even knowing databases can be the same across systems that are common per vendor installations because every business is unique. Adding to business differences, users are another variable in the equation. Bringing those together, we can come to an overall equation that will typically end in a varying result.
Beyond normal performance tuning guidelines, capturing the unique impact on the database server is critical to know where performance during normal operations stands. This allows managing of predictable performance changes and more importantly, monitoring of unpredictable performance variations. Without baselines, we can tune database performance, but are not able to tune database performance to the fullest extent for the unique business and user impacts.
Active Monitoring
Active monitoring probably isn’t something unfamiliar. There are several third party tools available to provide real-time monitoring of database servers. With work, active monitoring can be achieved from within the feature set that SQL Server provides. SQL Server Integration Services provides great value in monitoring operating system key performance indicators in next to real-time. Power Shell can efficiently gather the same operating system level data and several other methods can apply. (Five ways to do everything: pick the most efficient) Internally, Dynamic Management Views (DMV) and Dynamic Management Functions (DMF) provide a vast amount of information regarding performance. These can be read, measured and notifications sent when thresholds are reached.
Active monitoring means next to real-time notifications of severe and critical problems affecting the users. This comes down to the seconds and minutes game. In order to gather information in these intervals, the performance impact that we make on the servers must be taken into consideration itself. The development and management that goes into third party monitoring tools is vast and focused. This makes these tools friendlier in implementations and portability. It allows us to achieve efficiency in performing our tasks as administrators. However, each third party monitoring tool should be chosen and matched to the particular database landscape and internal guidelines. A good example of this is, allowing system object to be installed on instances or security level access. Some reporting options can even make the difference in decisions. Chose them wisely and take advantage of trial editions to beat them up so there are no surprises or neighbor envy later on.
Reporting Performance
Reporting performance can be confused with real-time monitoring but it is very different. Over time, databases change and their needs change along with them. In some cases this change is drastic and others can take months to happen. Reporting on overall performance over time periods will show these changes. Gradual progressive changes can show either performance problems or growth itself requiring action to prepare for the future.
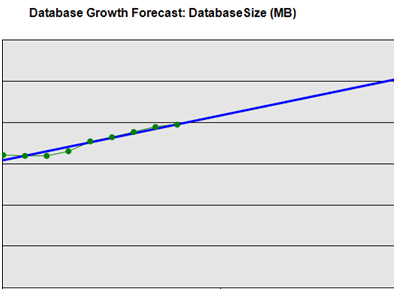
Database growth for example is captured over long periods of time. This falls into reporting performance for the reason we can plan to handle the growth in the future. We can also perform tasks such as expanding the size of the database when required. This can prevent unwanted growth during peak operating times and essentially high resource consumption and directly affecting the users.
Below in the graph, we see the green points as actual growth. With this we can forecast the growth into the future. Without this data we may not know that in Month 11 we will need to either expand disk or replace the entire subsystem itself to handle the growth. With that growth, resources will be consumed more so hardware upgrades to the server itself may be required.
Reporting performance is where the term, Performance Note is introduced.
Performance Notes
These events can occur over months, days and even hours. They are subtle and large spikes from the baseline performance we captured from normal performance impacts. These events are typically not performance problems that directly affect the users but neglected over time, can become severe problems.
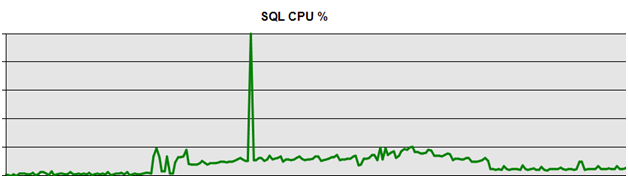
Take the graph below for an example where CPU usage over a day is represented. In the graph we see in the beginning of the day, utilization is very low. Then at a certain time, CPU starts showing normal activity. In the middle of the day a large spike in CPU occurs. This spike should be noted and in the following days monitoring of the performance notations should be done if it is unknown to the baseline.
Below is a graph of CPU usage over the two days after making the observation of the spike in CPU.
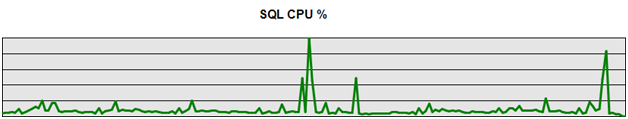
We can see that the spikes occur in both days and similar times.
These performance notes should be looked into closely to determine what is impacting the CPU usage during the time of the spikes. Often the spikes are found to be normal business operations but in some cases they are found to be performance problems that should be resolved.
With this we can put perfmon/profiler and other tools at our disposal to work by collecting more detailed information during and around the spike in resource consumption. For example, if we see Processor Time counter high and correlate that to other common CPU counters and SQL counters, we can determine if we have common CPU bottlenecks like compilations, recompilation, parameterization etc… issues or simply a query that was introduced to the database server without our knowledge. Then we can act quickly on it by optimization of resources or the query(s) taking part in the spikes.
Conclusion
Given the methods you can take to be proactive on SQL Server to ensure problems are limited to your knowledge is a stable of being successful in delivering data to the business. With the steps and types of monitoring and reporting described, most situations can be caught, analyzed and resolved swiftly.


