


I have created several cross tab reports in the last few years. I have also seen several hacks with different ways to achieve what is actually already built into Reporting Services. To begin, let’s define what a cross tab report is.
According to Wikipedia, cross tab, or cross tabulation, means “the process of creating a contingency table from the multivariate frequency distribution of statistical variables.” To put that into laymen’s terms, you create a grid with a group of objects on the X (horizontal) axis and another group of objects on the Y (vertical) axis, and you then tally how many occurrences those two objects meet.
For example, let’s say we want a cross tab of our computer inventory by department. One axis would have our computer inventory types (desktop, laptop, tablet, smartphone) and the other axis would have our departments (IT, Finance, HR). Here’s how it might look:
![Sample Grid][1]
This is a pretty simple and common problem that a lot of people have to solve. Let’s take a look at this problem by starting with a database. Create a new database and run this [script][2]. It should create and populate three tables.
The key to a good report is great sql code. This simple query will power our cross tab report:
select
	it.itName,
	d.depName,
	count(i.PK_invID) as Total
from dbo.Inventory i
	inner join dbo.InventoryTypes it
		on i.FK_itID=it.PK_itID
	inner join dbo.Departments d
		on i.FK_depID=d.PK_depID
group by it.itName,
	d.depName
This query already exists in the stored procedure dbo.CrossTab that was created in the create script. This is the stored procedure that our report is going to use. If you execute the stored procedure, the numbers should look faintly like the numbers in the above grid, just laid out wrong.
Now that the data is set up and we’ve got our query, we’ll create a Report Server project in BIDS. For simplicity’s sake I’m going to assume you know how to set up a project, set up a data source, set up a new report file, and set up a new dataset (using the stored procedure dbo.CrossTab). If any of these steps have you lost, please ask for guidance on our SQL Server forum.
After getting everything set up, we should have a clean report file with a data source and data set all set up and ready to go. We’ll start by dragging a matrix onto the report. We’ll then set the matrix to use the data set we set up previously (I named mine dsInventory).
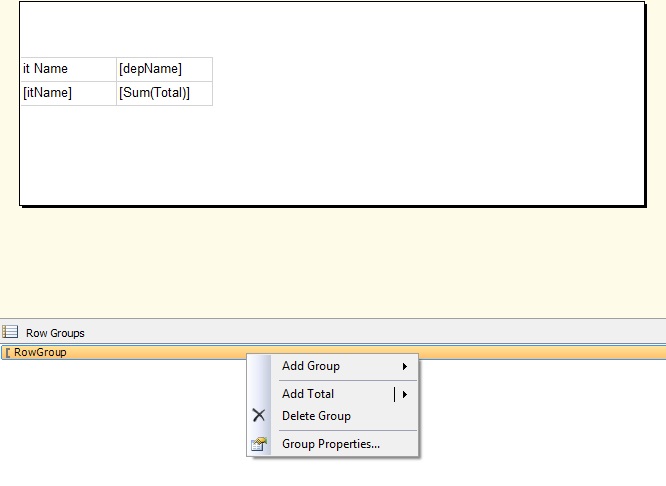
I then right-click the Row Group (at the bottom of the screen, this was automatically created for us when we created the matrix), select Group Properties, and set the Group On option to [itName]. I then set the Column Group to Group on [depName].
![Row Group][3]
Next, in the matrix itself where it says rows, I insert [itName]. Where Columns is I insert [depName]. After that I insert [Sum(Total)] in the data cell. If I then preview the report I get the exact same grid as I showed earlier, except the ordering may be wrong.
That’s it, that’s how much it takes to make a simple cross tab in Reporting Services. Note that the dbo.CrossTab query actually saved us some processing time by not requiring the report to figure out the total. We could have gotten the same results if we had just selected the raw data and let the report count each instance in the cross tab, but it’s a lot easier to figure out the totals in sql server than it is in reporting services in this instance.
Also, if you need to have more than one grouping on an axis (say, Year then month) you would set up a child group using the Column or Row Groups with the parent group being the larger grouping (year) and the child group being the smaller grouping (month). The designer should look something like this:
![Designer][4]
To summarize, some tasks are actually fairly simple to let reporting services do most of the work for you. Getting this sort of result just in SQL Server is rather difficult and time consuming. I hope you were able to follow along and learn a new trick that can save you time and effort on future projects. If you have any questions please don’t hesitate to ask.
[1]: https://lessthandot.z19.web.core.windows.net/wp-content/uploads/blogs/DataMgmt/thirster42/crosstab/Sample Grid.png “Sample Grid” [2]: http://textsnip.com/126ac4 [3]: https://lessthandot.z19.web.core.windows.net/wp-content/uploads/blogs/DataMgmt/thirster42/crosstab/RowGroup.png “Row Group” [4]: https://lessthandot.z19.web.core.windows.net/wp-content/uploads/blogs/DataMgmt/thirster42/crosstab/PS Designer.png “Designer”
