


This blog is part of my series Making Data Tell a Story With SSRS Properties.
Property: Label – Visible
The purpose of this property is to show the values of data points in the series on a chart.
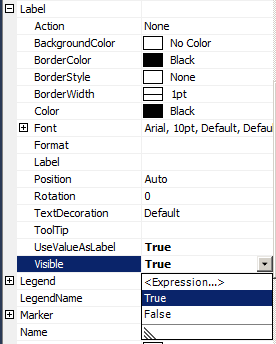
To access the property, go to the chart series properties, expand Label, and go to Visible.
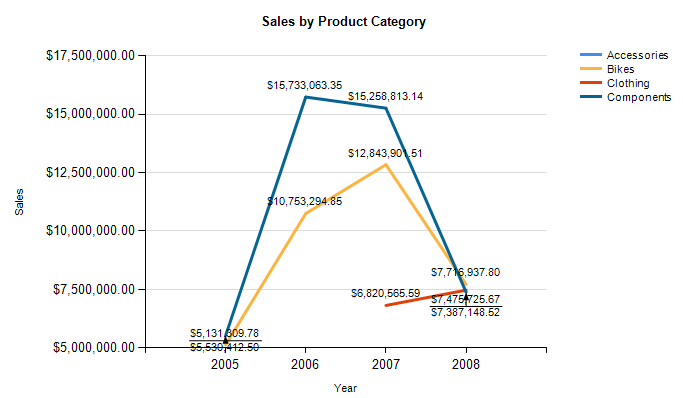
Example: I have a chart that shows sales by year, with a series for each product category.
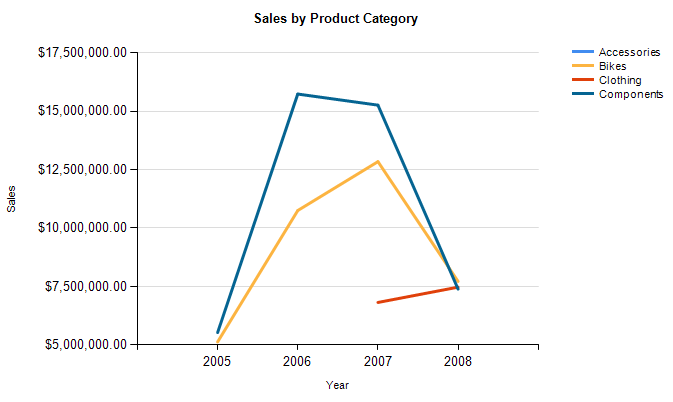
Because there are few data points on the chart, I want each value to show a label of the exact value.
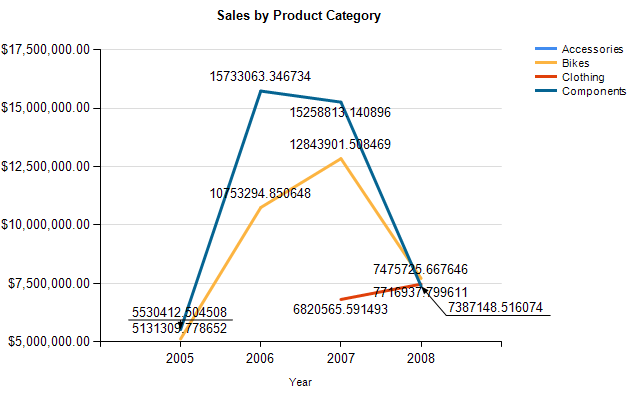
I go to the Design tab, select the series on the chart, expand Label, and set Visible to True.
I want this to look more readable. I set Font Size to 8, Format to “c” (currency), and Position to Top.
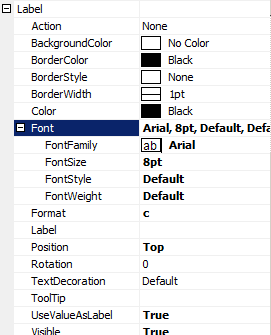
The chart is much more readable now.
Further Reading:
 Jes Borland is a Premier Field Engineer - SQL Server for Microsoft, where she is a trusted technical adviser, deep technical support, and teacher for her customers. Her experience as a DBA, consultant, and 5-time Data Platform MVP allow her to help the business and the IT teams reach their goals. She has worked with SQL Server as a developer, report writer, DBA, and consultant. Her favorite topics are administration, automation, and performance. She frequently presents at user groups, SQL Saturdays, and other community events. She is also an avid runner and chef.

