


I am writing this blog as an introduction to matrixes. In SQL Server 2005, Reporting Services has two main controls, tables and matrixes. Tables, however useful, only expand vertically. Matrixes, however, expand both horizontally and vertically, giving you a different view of data. A good set of data to view in a matrix is Quotes. Usually finance or operation will want to see how much money has been generated in quotes on a quarterly basis, and usually want to compare the quarters. This is a perfect job for a matrix. So lets start.
I am going to assume that the reader has experience in creating reports with tables. If you haven’t, please read my other blog here first. I have created a stored procedure for this blog. Here it is:
CREATE PROCEDURE [dbo].[ExampleData]
	-- Add the parameters for the stored procedure here

AS
BEGIN
	-- SET NOCOUNT ON added to prevent extra result sets from
	-- interfering with SELECT statements.
	SET NOCOUNT ON;

    -- Insert statements for procedure here

	declare @date table (Client nvarchar(10), QuoteID uniqueidentifier, Amount decimal(15,5), DateClosed datetime, Status nvarchar(10), Division int)

	insert into @date values ('a', newid(), 10, '1/1/08', 'Won', 1)
	insert into @date values ('a', newid(), 20, '2/1/09', 'Lost', 2)
	insert into @date values ('a', newid(), 30, '3/1/08', 'Won', 3)
	insert into @date values ('a', newid(), 40, null, 'Pending', 4)
	insert into @date values ('a', newid(), 50, '5/1/08', 'Lost', 5)
	insert into @date values ('a', newid(), 60, '6/1/09', 'Won', 5)
	insert into @date values ('a', newid(), 70, '7/1/09', 'Won', 4)
	insert into @date values ('a', newid(), 80, '8/1/09', 'Won', 3)
	insert into @date values ('a', newid(), 90, null, 'Pending', 2)
	insert into @date values ('a', newid(), 100, '10/1/09', 'Lost', 1)

	insert into @date values ('b', newid(), 15, '12/1/08', 'Won', 1)
	insert into @date values ('b', newid(), 25, '1/1/09', 'Lost', 1)
	insert into @date values ('b', newid(), 35, '2/1/09', 'Won', 1)
	insert into @date values ('b', newid(), 45, null, 'Pending', 2)
	insert into @date values ('b', newid(), 55, '3/1/08', 'Lost', 2)
	insert into @date values ('b', newid(), 65, '4/1/08', 'Won', 2)
	insert into @date values ('b', newid(), 75, '5/1/09', 'Won', 3)
	insert into @date values ('b', newid(), 85, '6/1/09', 'Won', 3)
	insert into @date values ('b', newid(), 95, null, 'Pending', 3)
	insert into @date values ('b', newid(), 150, '7/1/09', 'Lost', 4)

	insert into @date values ('c', newid(), 100, '8/1/08', 'Won', 4)
	insert into @date values ('c', newid(), 200, '9/1/08', 'Lost', 4)
	insert into @date values ('c', newid(), 300, '10/1/08', 'Won', 5)
	insert into @date values ('c', newid(), 400, null, 'Pending', 5)
	insert into @date values ('c', newid(), 500, '11/1/09', 'Lost', 5)
	insert into @date values ('c', newid(), 600, '12/1/09', 'Won', 1)
	insert into @date values ('c', newid(), 700, '1/1/09', 'Won', 2)
	insert into @date values ('c', newid(), 800, '2/1/09', 'Won', 3)
	insert into @date values ('c', newid(), 900, null, 'Pending', 4)
	insert into @date values ('c', newid(), 1000, '3/1/08', 'Lost', 5)


	select
		case when coalesce(month(DateClosed),month(getdate())) between 1 and 3 then 1
			when coalesce(month(DateClosed),month(getdate())) between 4 and 6 then 2
			when coalesce(month(DateClosed),month(getdate())) between 7 and 9 then 3
			when coalesce(month(DateClosed),month(getdate())) between 10 and 12 then 4
		end as Qtr,
		coalesce(year(DateClosed),year(getdate())) as Yr,
		*
	from @date
	order by
		Yr,
		Qtr,
		Division,
		Status,
		Client


END

GO
Now, first things first. A new report project has to be made for this report. Once a new project is open, create a new data source that points to the database where you created the stored procedure. Now, once the data source is created create a new report. Remember, we don’t want to use the wizard (this is a hands-on blog, after all).
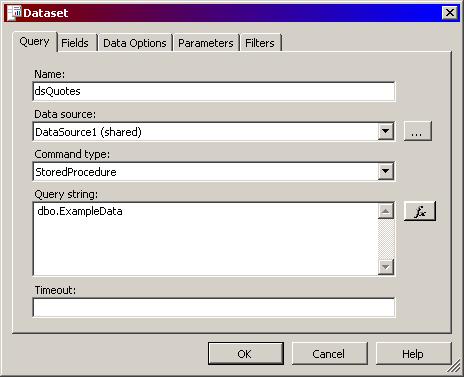
You should now have a sparkling new report open and ready to be edited. If not on the data tab, move to it. Create a new data set that points to the stored procedure we created. I’m going to name mine dsQuotes.
Hit the exclamation mark to make sure it runs, and then go to the Layout tab. Drag and drop a matrix control from the toolbox window. A new matrix control will be created on the report.
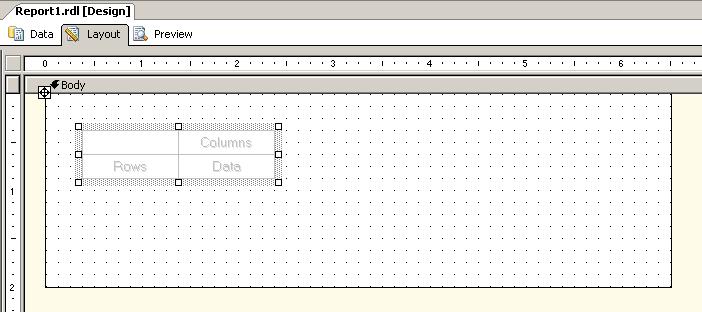
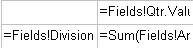
From the dataset window, drag the field Qtr onto the Columns cell. Drag the Division field onto the Rows cell. Last but not least, drag the Amount field onto the Data field. Notice that the matrix automatically put sum() around it. Your matrix should look like this:
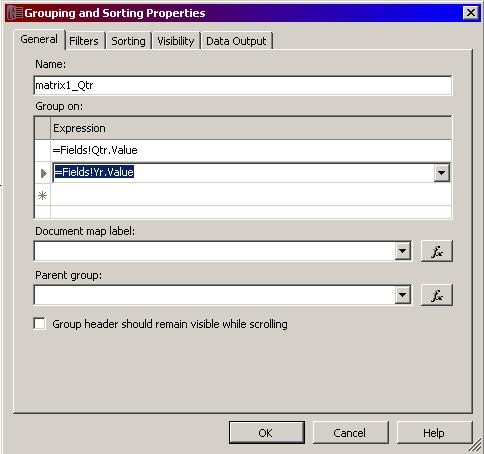
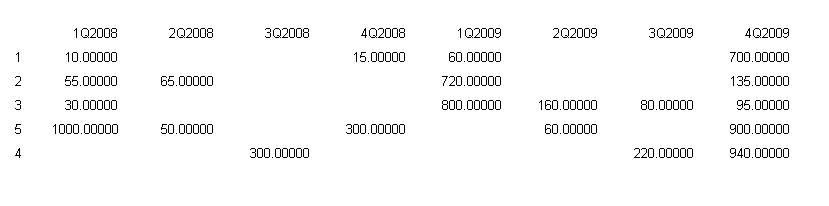
Go ahead and click Preview. What pops up is the matrix showing you the sums of each quarter for each Division. This is wrong, however, because it is not taking into account the year. Return to the layout tab and go to the matrix properties. If you click the groups tab, you can see that the matrix automatically greated groups for both division and Qtr.
Click the Qtr group and click edit. In the cell under Qtr, add the Yr field.
Now the group will group by Qtr and Yr. However, the header is still currently set up to only display Qtr. Right-click the Qtr field and click expression. In the window that pops up, type the following:
=Fields!Qtr.Value & “Q” & Fields!Yr.Value
Click ok and click preview. You should now get sums by quarter/year by division.
Now what we need is to show the amounts by quote status. Go back to the Layout tab. Drag and drop the Status field onto the Division field. This will automatically create a new column to the right. Also, if you look at the table groups, a new group for the Status field has been made.
I’m going to go ahead and take some time to make things pretty so that it’s easier to tell what’s what. After that, go ahead and click preview. Since the data is so sparse in this dataset, the order of the statuses will be subjective to whatever shows up first.
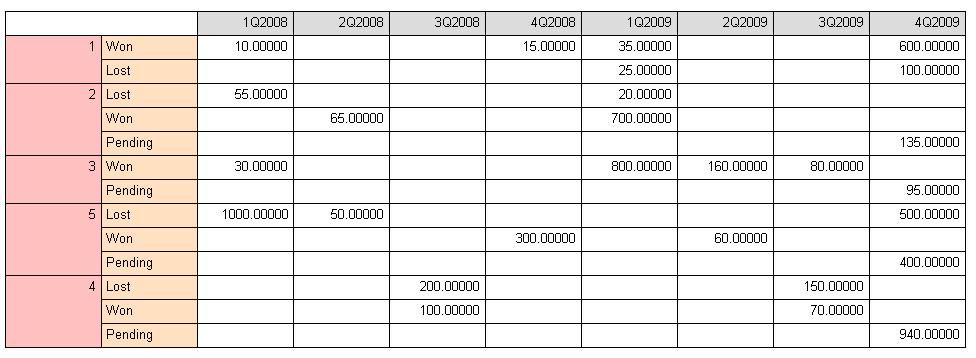
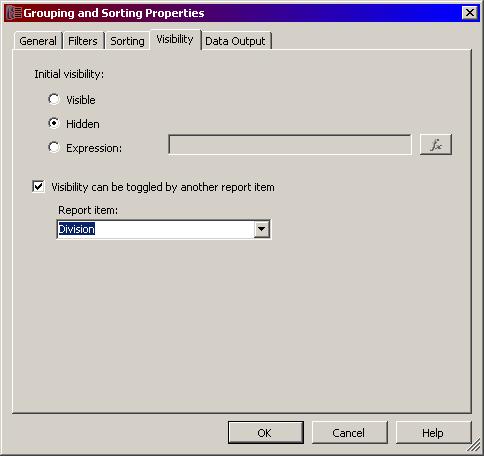
Now this is pretty neat. We can see how much money each division won, lost, or has pending. However, our overall sum is now gone. Don’t worry! We can get it back. Go back to the layout tab and go to the properties of the matrix. Under the groups tab edit the Status group. Go to the visibility tab. Set the group so that it’s hidden by default and can be toggled by Division.
Click ok and preview the report. Tada! Now you see the overall sums, and if you want you can drill down into the status amounts. This is one of the cool things about matrixes. The data cell changes to aggregate by whatever groups are visible.
Since data can be looked at in so many different angles, having the data in a matrix can drastically reduce the amount of reports you have to make. Go ahead and play around with the matrix and see what you can make.
Also, please let me know of any feedback, criticism, or questions you may have.
