


The Default Trace exists in SQL Server 2005 and higher versions, in all editions. The trace has been questioned: what is it, and why is it helpful? We will go over the answers to these questions and look into the Default Trace, showing how to use it to retrieve information it collects while enabled.
What is the Default Trace?
The Default Trace is a trace prepackaged into SQL Server and enabled by default when you install SQL Server. You cannot alter the events the Default Trace captures but can disable the trace by executing the following.
The Default Trace’s value may provide a reason to leave the trace enabled. The code below is provided to show of how to disable it is provided in case the need arises for it to be disabled.
sp_configure 'show advanced options', 1
GO
RECONFIGURE
GO
sp_configure 'default trace enabled', 0
GO
RECONFIGURE
GO
The Default Trace tracks events that revolve around configurations changes and collects information on changes such as ALTER object events and login failures. Since the trace is not documented thoroughly in Books Online, we need to execute a query to determine the events that are being captured. This is done by using fn_trace_geteventinfo, fn_trace_getinfo, sys.trace_events and sys.trace_columns as shown below.
SELECT
	TraceEvents.name as [Event],
	TraceData.name as [Data Collected]
FROM ::fn_trace_geteventinfo((SELECT TOP 1 TraceID FROM ::fn_trace_getinfo(default))) TraceInfo
JOIN sys.trace_events TraceEvents ON TraceInfo.eventID = TraceEvents.trace_event_id
JOIN sys.trace_columns TraceData ON TraceInfo.columnid = TraceData.trace_column_id
The results of the unique event names

As with other traces, not all columns have available data pertaining to the specific event. If a value is NULL, it is likely that the information is not available for the captured event. This can be verified by using the query shown above, by checking the Data Collected values returned.
Default Trace in action – Why is it helpful?
When working in a DBA Team, it can be important to know when something was changed and who made the change, in SQL Server. This information is used for auditing and troubleshooting.
Here we will test the capture of TABLE CREATE, ALTER and DROP running the following with the default trace enabled.
CREATE TABLE Junked (COL INT)
GO
ALTER TABLE Junked
 ADD COL2 VARCHAR(10)
GO
DROP TABLE Junked
GO
To query the event that was forced above, we can use the fn_trace_gettable to load the trace file into a table format. The trace file that is current can be found by running the fn_trace_getinfo.
SELECT * FROM ::fn_trace_getinfo(default)
Load the file that was represented in the property value 2 row returned.
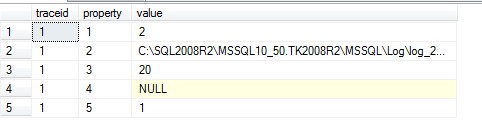
Then use the file path as:
SELECT
	TraceInfo.ServerName,
	TraceInfo.StartTime,
	TraceInfo.LoginName,
	TraceInfo.ObjectName,
	TraceEvents.name
FROM
::fn_trace_gettable('C:SQL2008R2MSSQL10_50.TK2008R2MSSQLLoglog_257.trc',0) TraceInfo
JOIN sys.trace_events TraceEvents ON TraceInfo.eventclass = TraceEvents.trace_event_id
WHERE ObjectName = 'Junked'
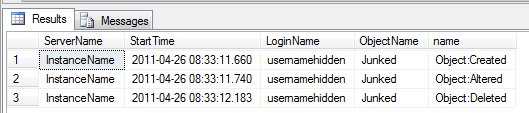
From the illustration above, we can see that the table “Junked” was created, altered and then deleted. This information can be invaluable in the event a table was dropped or altered, in the event that change caused a severe problem to the functionality of the table. The time that the table was changed can show a specific set of events that may have led up to it, or reasoning they occurred. Further value is seen in audit reporting on production systems that require change control.


